Technical Analysis of MTEX 2024-05-31
Overview:
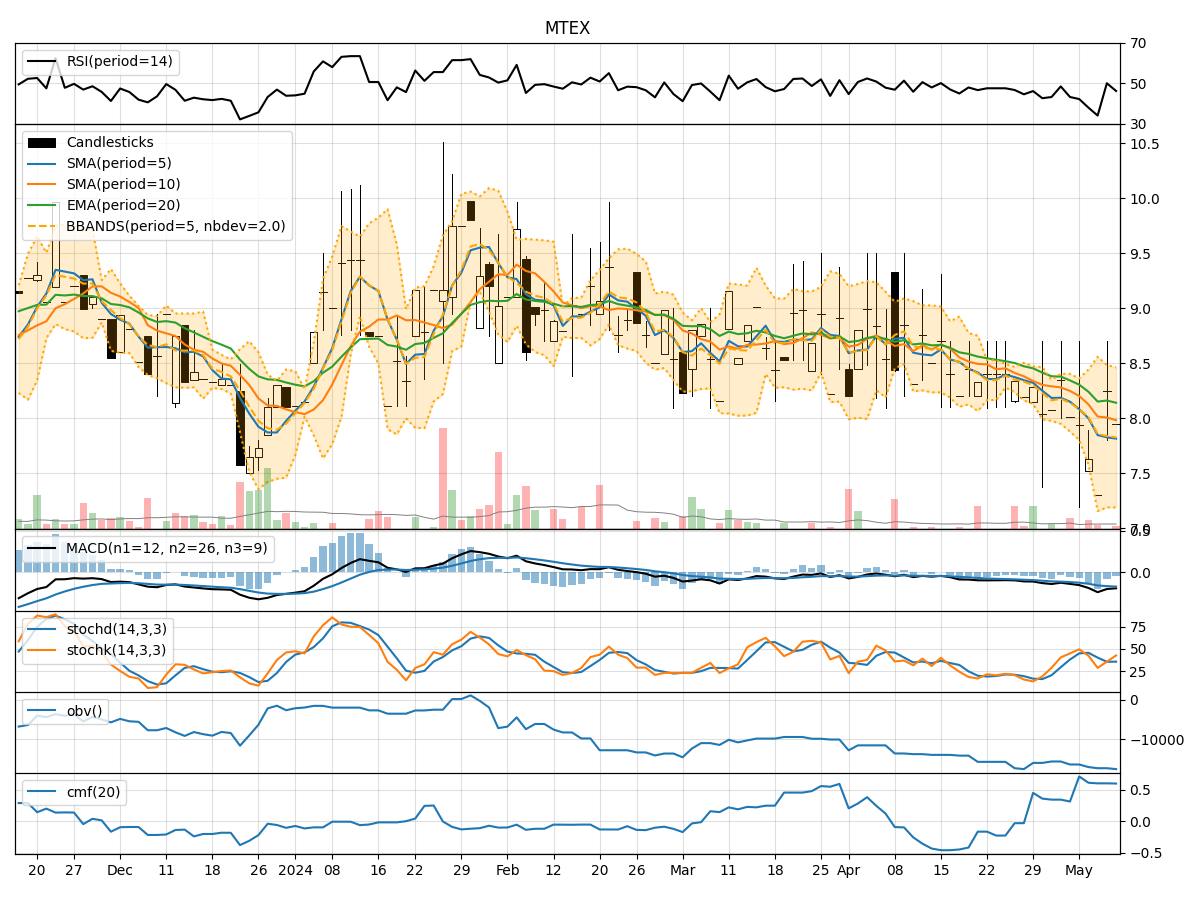
In analyzing the technical indicators for MTEX over the last 5 days, we will delve into the trend, momentum, volatility, and volume indicators to provide a comprehensive assessment of the stock's potential price movement. By examining these key factors, we aim to offer valuable insights and predictions for the next few days.
Trend Analysis:
- Moving Averages (MA): The 5-day Moving Average (MA) has been showing an upward trend, indicating a positive momentum in the stock price.
- MACD: The Moving Average Convergence Divergence (MACD) has been consistently positive, suggesting a bullish trend in the stock.
- EMA: The Exponential Moving Average (EMA) has also been trending upwards, supporting the bullish sentiment in the short term.
Momentum Analysis:
- RSI: The Relative Strength Index (RSI) has been fluctuating around the neutral zone, indicating a lack of strong momentum in either direction.
- Stochastic Oscillator: The Stochastic Oscillator has been oscillating within the range, not providing a clear signal of overbought or oversold conditions.
- Williams %R: The Williams %R is in the oversold territory, suggesting a potential reversal in the stock price.
Volatility Analysis:
- Bollinger Bands: The Bollinger Bands have shown narrowing volatility, indicating a potential decrease in price fluctuations.
- Bollinger %B: The Bollinger %B is close to the lower band, signaling a possible oversold condition in the stock.
Volume Analysis:
- On-Balance Volume (OBV): The OBV has been negative, indicating selling pressure in the stock.
- Chaikin Money Flow (CMF): The CMF has been relatively stable, suggesting a balance between buying and selling pressure.
Key Observations:
- The trend indicators suggest a bullish sentiment in the short term, supported by positive MA, MACD, and EMA.
- Momentum indicators show mixed signals with RSI in a neutral zone and Williams %R in the oversold territory.
- Volatility is decreasing based on Bollinger Bands, potentially leading to a period of consolidation.
- Volume indicators indicate selling pressure with a negative OBV, although the CMF shows a balanced flow of money.
Conclusion:
Based on the analysis of the technical indicators, the next few days for MTEX could see sideways movement or consolidation as the stock price stabilizes. The bullish trend indicated by the trend indicators may face resistance due to the lack of strong momentum and selling pressure reflected in the volume indicators. Traders should exercise caution and monitor key levels closely for potential reversals or breakout opportunities.