Technical Analysis of MTLS 2024-05-10
Overview:
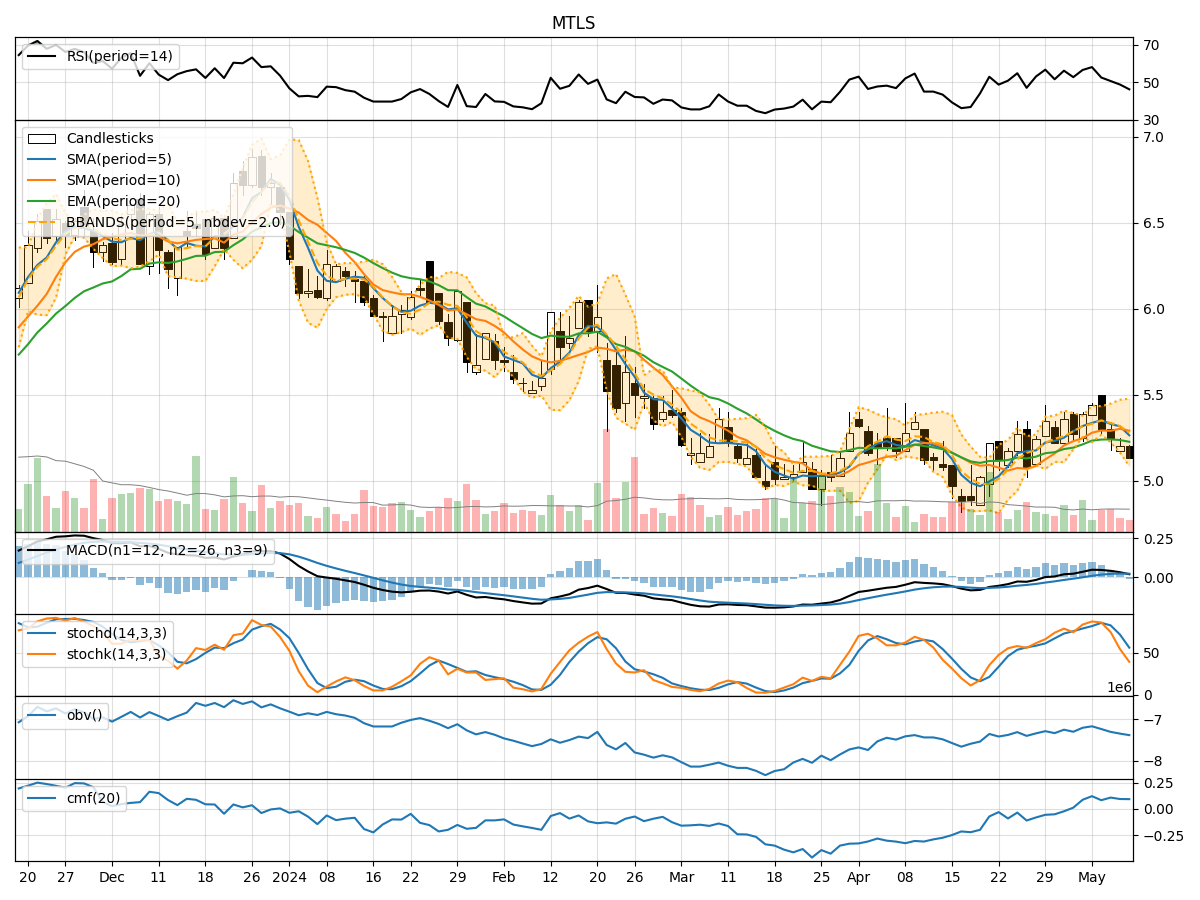
In analyzing the technical indicators for MTLS over the last 5 days, we will delve into the trend, momentum, volatility, and volume indicators to provide a comprehensive outlook on the possible stock price movement in the coming days. By examining these key indicators, we aim to offer valuable insights and predictions for potential investors.
Trend Analysis:
- Moving Averages (MA): The 5-day Moving Average (MA) has been fluctuating around the closing prices, indicating short-term price trends.
- MACD: The Moving Average Convergence Divergence (MACD) shows positive values, suggesting a bullish momentum in the stock.
- EMA: The Exponential Moving Average (EMA) has been relatively stable, reflecting a consistent price trend.
Key Observation: The trend indicators suggest a neutral to slightly bullish sentiment in the stock price movement.
Momentum Analysis:
- RSI: The Relative Strength Index (RSI) has been declining, indicating a weakening momentum.
- Stochastic Oscillator: Both %K and %D have been decreasing, signaling a bearish momentum.
- Williams %R: The Williams %R is in oversold territory, suggesting a potential reversal.
Key Observation: Momentum indicators point towards a bearish sentiment in the stock price movement.
Volatility Analysis:
- Bollinger Bands (BB): The Bollinger Bands have been narrowing, indicating decreasing volatility.
- BB% (BB Percentage): The BB% has been relatively low, suggesting a stable price range.
Key Observation: Volatility indicators imply a period of consolidation or sideways movement in the stock price.
Volume Analysis:
- On-Balance Volume (OBV): The OBV has been declining, indicating selling pressure in the stock.
- Chaikin Money Flow (CMF): The CMF has been fluctuating around zero, reflecting a balance between buying and selling pressure.
Key Observation: Volume indicators suggest a neutral sentiment with a slight inclination towards selling pressure.
Conclusion:
Based on the analysis of trend, momentum, volatility, and volume indicators, the stock price of MTLS is likely to experience further downward movement in the coming days. The bearish momentum indicated by the RSI and Stochastic Oscillator, coupled with declining OBV, supports this view. Additionally, the narrowing Bollinger Bands and stable BB% suggest a period of consolidation or sideways movement before a potential reversal.
Key Conclusion: The overall outlook for MTLS is bearish in the short term, with a possibility of consolidation before a potential reversal. Investors should exercise caution and consider waiting for more definitive signals before making trading decisions.