Technical Analysis of MYPS 2024-05-10
Overview:
In analyzing the technical indicators for MYPS stock over the last 5 days, we will delve into the trend, momentum, volatility, and volume indicators to provide a comprehensive outlook on the possible future stock price movement. By examining these key indicators, we aim to offer valuable insights and recommendations for potential investors.
Trend Analysis:
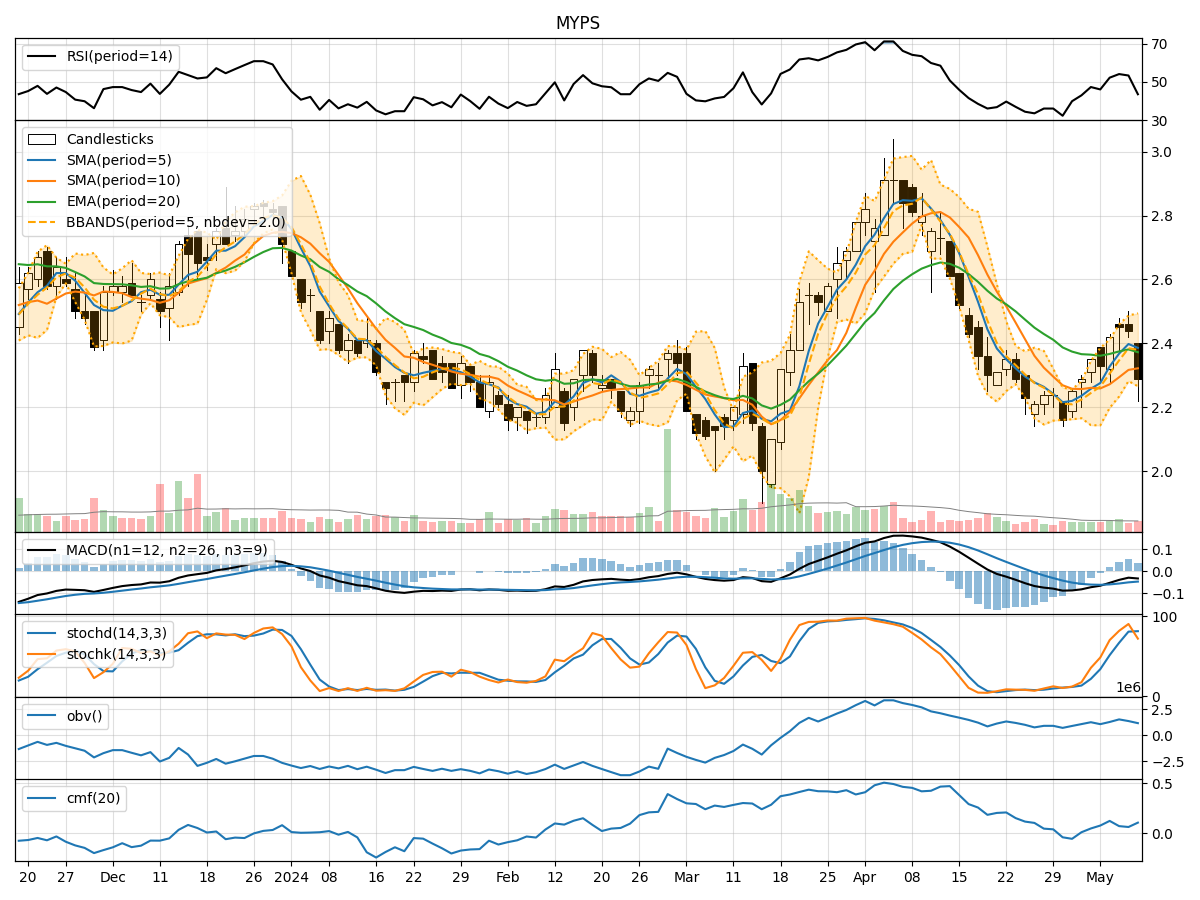
- Moving Averages (MA): The 5-day Moving Average (MA) has been fluctuating around the closing prices, indicating short-term price trends. The Simple Moving Average (SMA) and Exponential Moving Average (EMA) show a slight uptrend, suggesting a potential bullish sentiment.
- MACD: The Moving Average Convergence Divergence (MACD) has been negative but showing signs of convergence towards the signal line, indicating a possible trend reversal.
- Momentum: The momentum indicators suggest a mixed sentiment with the Relative Strength Index (RSI) hovering around the neutral zone, and the Stochastic Oscillator showing overbought conditions on some days.
Momentum Analysis:
- RSI: The RSI has been fluctuating around the 50 level, indicating indecision in the market.
- Stochastic Oscillator: The Stochastic indicators have shown overbought conditions, suggesting a potential reversal in the short term.
- Williams %R: The Williams %R is in the oversold territory, indicating a possible buying opportunity.
Volatility Analysis:
- Bollinger Bands: The Bollinger Bands have been narrowing, suggesting decreasing volatility in the stock price.
- Volatility Bands: The volatility bands have been relatively stable, indicating a lack of significant price fluctuations.
Volume Analysis:
- On-Balance Volume (OBV): The OBV has been fluctuating, indicating mixed buying and selling pressure.
- Chaikin Money Flow (CMF): The CMF has been positive, suggesting a potential inflow of money into the stock.
Conclusion:
Based on the analysis of the technical indicators, the stock price of MYPS is likely to experience sideways consolidation in the near term. The trend indicators show a potential bullish sentiment, while the momentum indicators suggest a mixed market sentiment. The volatility is decreasing, indicating a possible stabilization in the stock price. The volume indicators show mixed buying and selling pressure, further supporting the sideways movement.
Overall, the stock is expected to trade within a narrow range in the coming days, with no clear directional bias. Investors should exercise caution and closely monitor the key technical levels for potential breakout opportunities.