Technical Analysis of MYSZ 2024-05-10
Overview:
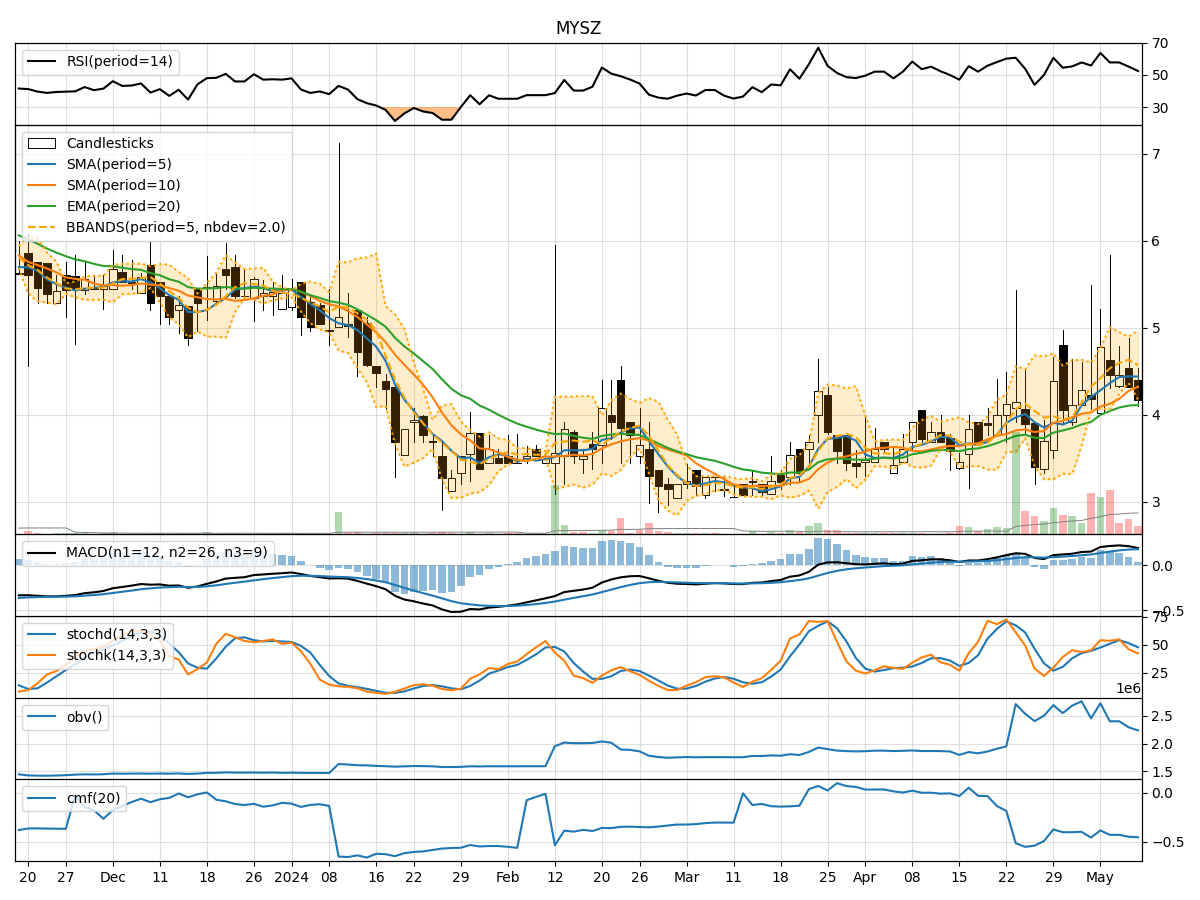
In analyzing the technical indicators for MYSZ over the last 5 days, we will delve into the trend, momentum, volatility, and volume indicators to provide a comprehensive outlook on the possible stock price movement in the coming days.
Trend Analysis:
- Moving Averages (MA): The 5-day MA has been consistently above the closing prices, indicating a short-term uptrend.
- MACD: The MACD line has been above the signal line, suggesting bullish momentum.
- EMA: The exponential moving average has been trending upwards, supporting the bullish sentiment.
Key Observation: The trend indicators point towards a bullish outlook for MYSZ.
Momentum Analysis:
- RSI: The RSI has been declining but remains above the oversold threshold of 30, indicating a potential reversal.
- Stochastic Oscillator: Both %K and %D have been decreasing, signaling a potential bearish momentum.
- Williams %R: The indicator has been in the oversold territory, suggesting a possible reversal.
Key Observation: Momentum indicators are mixed, with a slight bearish bias.
Volatility Analysis:
- Bollinger Bands (BB): The stock price has been trading within the bands, indicating normal volatility.
- Bollinger Band %B: The %B indicator has been fluctuating around the midline, suggesting balanced volatility.
Key Observation: Volatility indicators suggest a stable price movement with no extreme fluctuations.
Volume Analysis:
- On-Balance Volume (OBV): The OBV has been relatively stable, indicating a balance between buying and selling pressure.
- Chaikin Money Flow (CMF): The CMF has been negative, suggesting a slight distribution phase.
Key Observation: Volume indicators show a neutral stance with no significant accumulation or distribution.
Conclusion:
Based on the analysis of the technical indicators: - Trend: Upward - Momentum: Slightly Bearish - Volatility: Stable - Volume: Neutral
Overall Assessment:
Considering the bullish trend indicators, stable volatility, and neutral volume signals, the stock price of MYSZ is likely to experience upward movement in the coming days. However, the slightly bearish momentum indicators suggest the possibility of short-term corrections or consolidation before resuming the upward trend.
Recommendation: Investors may consider accumulating positions on dips for potential long-term gains, while short-term traders should closely monitor the momentum indicators for timely entry and exit points.
Always remember to conduct further research and consider fundamental factors before making investment decisions.