Technical Analysis of NAMS 2024-05-10
Overview:
In analyzing the technical indicators for NAMS stock over the last 5 days, we will delve into the trend, momentum, volatility, and volume indicators to provide a comprehensive outlook on the possible stock price movement in the coming days. By examining these key indicators, we aim to offer valuable insights and predictions for potential investors.
Trend Indicators:
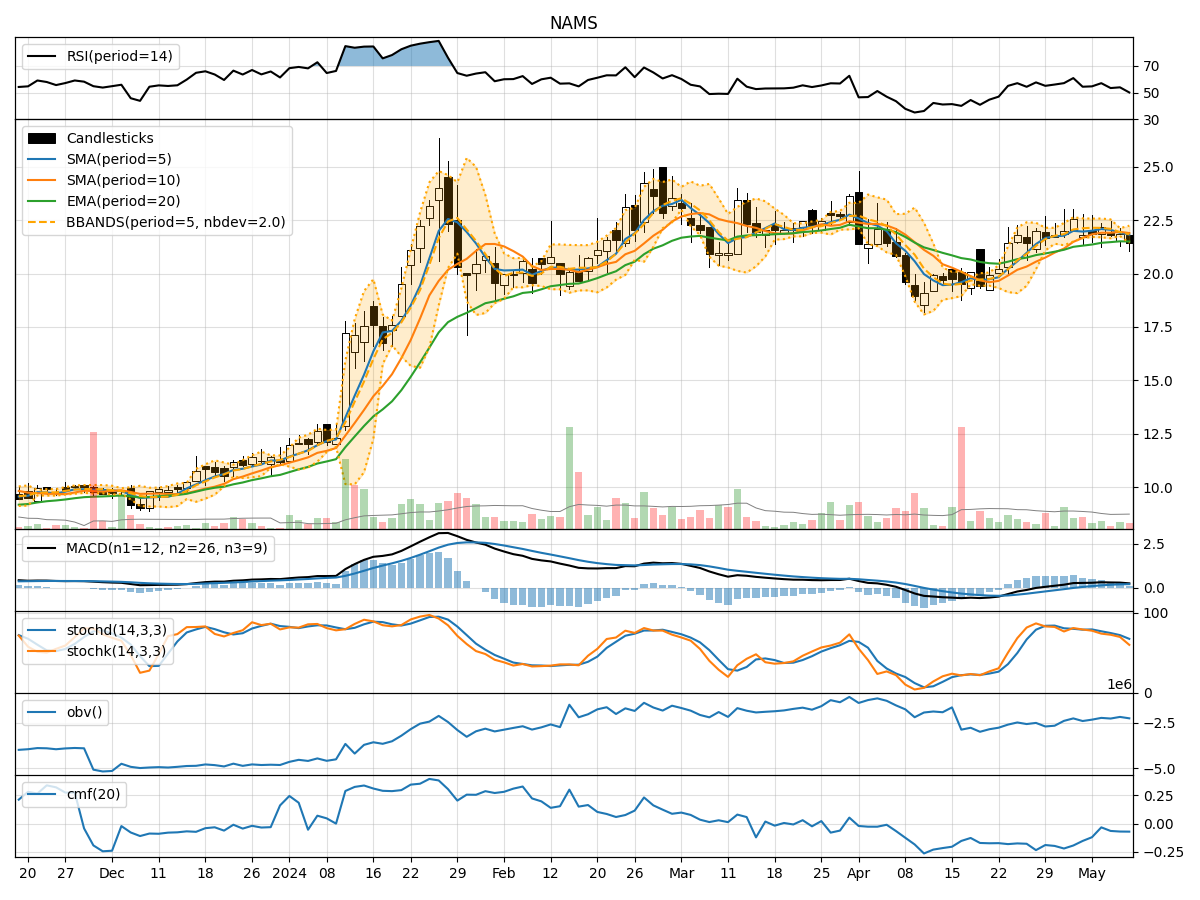
- Moving Averages (MA): The 5-day MA has been fluctuating around the closing prices, indicating short-term price trends. The SMA(10) and EMA(20) have shown slight variations but have not diverged significantly.
- MACD: The MACD line has been positive, indicating a bullish momentum, although the MACD histogram has been decreasing slightly.
- Conclusion: The trend indicators suggest a neutral to slightly bullish outlook for the stock.
Momentum Indicators:
- RSI: The RSI has been hovering around the mid-range, indicating a balanced momentum between buying and selling pressure.
- Stochastic Oscillator: Both %K and %D have been declining, suggesting a potential weakening of the bullish momentum.
- Conclusion: The momentum indicators point towards a neutral to slightly bearish sentiment for the stock.
Volatility Indicators:
- Bollinger Bands (BB): The stock price has been trading within the bands, with the BB% showing minimal fluctuations.
- Conclusion: Volatility remains relatively stable, indicating a sideways or consolidating price movement.
Volume Indicators:
- On-Balance Volume (OBV): The OBV has shown mixed movements, reflecting indecision among investors.
- Chaikin Money Flow (CMF): The CMF has been negative, indicating a slight outflow of money from the stock.
- Conclusion: Volume indicators suggest a neutral to slightly bearish sentiment in terms of investor participation.
Overall Conclusion:
Based on the analysis of the trend, momentum, volatility, and volume indicators, the overall outlook for NAMS stock in the next few days leans towards a neutral to slightly bearish stance. While the trend indicators show a potential for a bullish continuation, the momentum and volume indicators signal a lack of strong buying interest and a possible shift towards a bearish sentiment. The volatility indicators imply a sideways or consolidating price movement in the near term.
Recommendation:
Considering the mixed signals from the technical indicators, it is advisable for investors to exercise caution and closely monitor the stock's price action in the coming days. It would be prudent to wait for clearer signals or confirmation of a trend direction before making any significant trading decisions. Conducting further analysis and staying updated on market developments can help in making informed investment choices.
Disclaimer:
This analysis is based solely on the provided technical indicators and does not take into account fundamental factors or external market influences. It is essential to conduct thorough research and consider multiple sources of information before making any investment decisions. Consulting with a financial advisor is recommended to tailor strategies to individual risk tolerance and investment goals.