Technical Analysis of NBTX 2024-05-10
Overview:
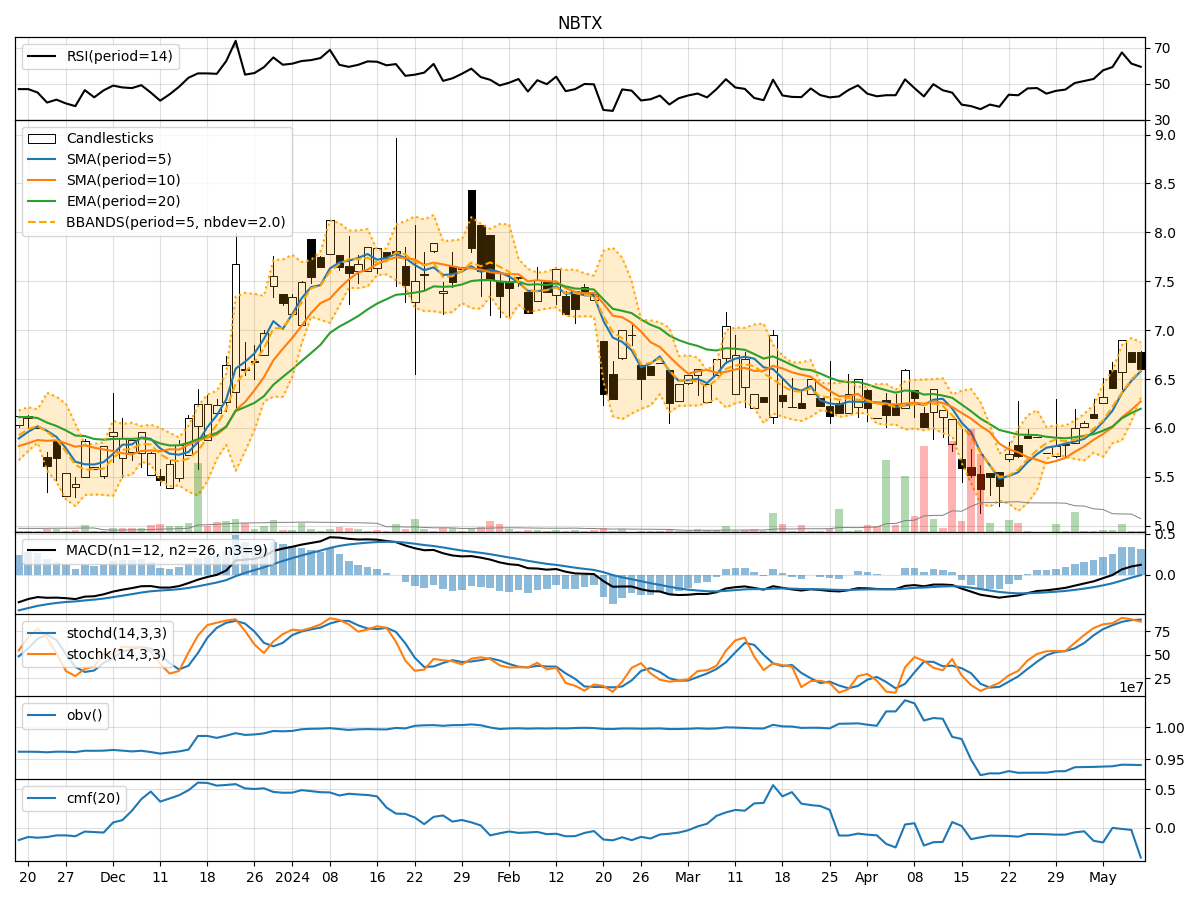
In analyzing the technical indicators for NBTX over the last 5 days, we will delve into the trends, momentum, volatility, and volume aspects to provide a comprehensive outlook on the possible stock price movement. By examining key indicators such as moving averages, MACD, RSI, Bollinger Bands, and OBV, we aim to offer valuable insights and predictions for the upcoming days.
Trend Analysis:
- Moving Averages (MA): The 5-day moving average has been consistently above the closing prices, indicating a bullish trend.
- MACD: The MACD line has been above the signal line for the past few days, suggesting a bullish momentum.
- EMA: The exponential moving average has been trending upwards, supporting the bullish sentiment.
Key Observation: The trend indicators point towards an upward movement in the stock price.
Momentum Analysis:
- RSI: The Relative Strength Index has been fluctuating but generally staying within the neutral range, indicating a balanced momentum.
- Stochastic Oscillator: Both %K and %D have been relatively high, suggesting a strong buying momentum.
- Williams %R: The indicator has been in the oversold territory, signaling a potential reversal.
Key Observation: The momentum indicators suggest a bullish sentiment in the short term.
Volatility Analysis:
- Bollinger Bands: The stock price has been trading within the bands, indicating moderate volatility.
- Bollinger %B: The %B value has been fluctuating around 0.5, suggesting a balanced volatility level.
Key Observation: Volatility indicators point towards a sideways movement in the stock price.
Volume Analysis:
- On-Balance Volume (OBV): The OBV has been declining, indicating a decrease in buying pressure.
- Chaikin Money Flow (CMF): The CMF has been negative, suggesting a bearish money flow.
Key Observation: Volume indicators signal a bearish sentiment in the market.
Conclusion:
Based on the comprehensive analysis of the technical indicators, the next few days' possible stock price movement for NBTX is likely to be upward in the short term, supported by the bullish trend and momentum indicators. However, the sideways volatility and bearish volume indicators may introduce some uncertainty and potential pullbacks in the price. Traders should closely monitor the price action and key support/resistance levels for timely decision-making.
Overall Outlook: Upward with potential short-term fluctuations due to volatility and volume pressures.