Technical Analysis of NCMI 2024-05-10
Overview:
In analyzing the technical indicators for NCMI over the last 5 days, we will delve into the trend, momentum, volatility, and volume indicators to provide a comprehensive outlook on the possible stock price movement in the coming days.
Trend Indicators:
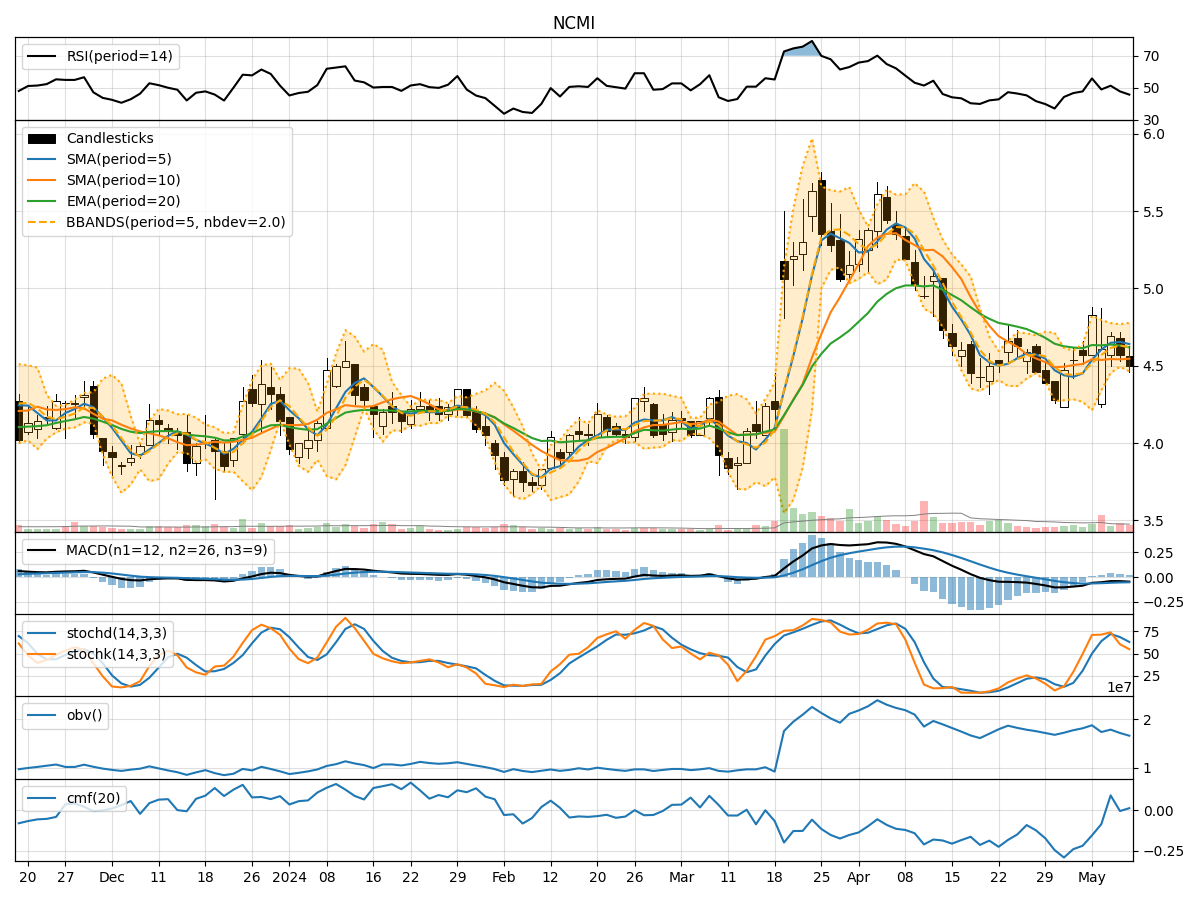
- Moving Averages (MA): The 5-day Moving Average (MA) has been fluctuating around the closing prices, indicating short-term price trends. The Simple Moving Average (SMA) and Exponential Moving Average (EMA) show a slight downward trend, with the EMA lagging behind.
- Moving Average Convergence Divergence (MACD): The MACD and Signal Line have been negative, suggesting a bearish momentum in the short term.
Momentum Indicators:
- Relative Strength Index (RSI): The RSI has been hovering around the 50 level, indicating a neutral stance in momentum.
- Stochastic Oscillator: Both %K and %D have been declining, pointing towards a potential bearish momentum.
- Williams %R (Willams %R): The Williams %R is in oversold territory, indicating a possible reversal in the short term.
Volatility Indicators:
- Bollinger Bands (BB): The Bollinger Bands have been narrowing, suggesting decreasing volatility in the stock price.
- Bollinger Band %B (BB %B): The %B is below 1, indicating the price is below the lower band, potentially signaling an oversold condition.
Volume Indicators:
- On-Balance Volume (OBV): The OBV has been fluctuating, indicating mixed buying and selling pressure.
- Chaikin Money Flow (CMF): The CMF has been negative, suggesting a bearish money flow in the stock.
Key Observations and Opinions:
- Trend: The trend indicators show a bearish sentiment with the moving averages sloping downwards and the MACD in negative territory.
- Momentum: Momentum indicators suggest a weakening momentum with the RSI around the neutral level and stochastic indicators pointing towards a bearish bias.
- Volatility: Volatility has been decreasing as indicated by the narrowing Bollinger Bands, potentially signaling a period of consolidation.
- Volume: The volume indicators show mixed signals with OBV fluctuating and CMF indicating a bearish money flow.
Conclusion:
Based on the analysis of the technical indicators, the next few days' possible stock price movement for NCMI is likely to be bearish. The trend indicators, momentum indicators, and volume indicators all point towards a bearish sentiment in the short term. The decreasing volatility and oversold conditions indicated by Williams %R and Bollinger Bands %B further support a potential downward movement in the stock price. Traders and investors should exercise caution and consider short-term bearish strategies in their decision-making process.