Technical Analysis of NCNO 2024-05-10
Overview:
In analyzing the technical indicators for NCNO over the last 5 days, we will delve into the trend, momentum, volatility, and volume indicators to provide a comprehensive outlook on the possible stock price movement. By examining these key aspects, we aim to offer valuable insights and predictions for the upcoming days.
Trend Analysis:
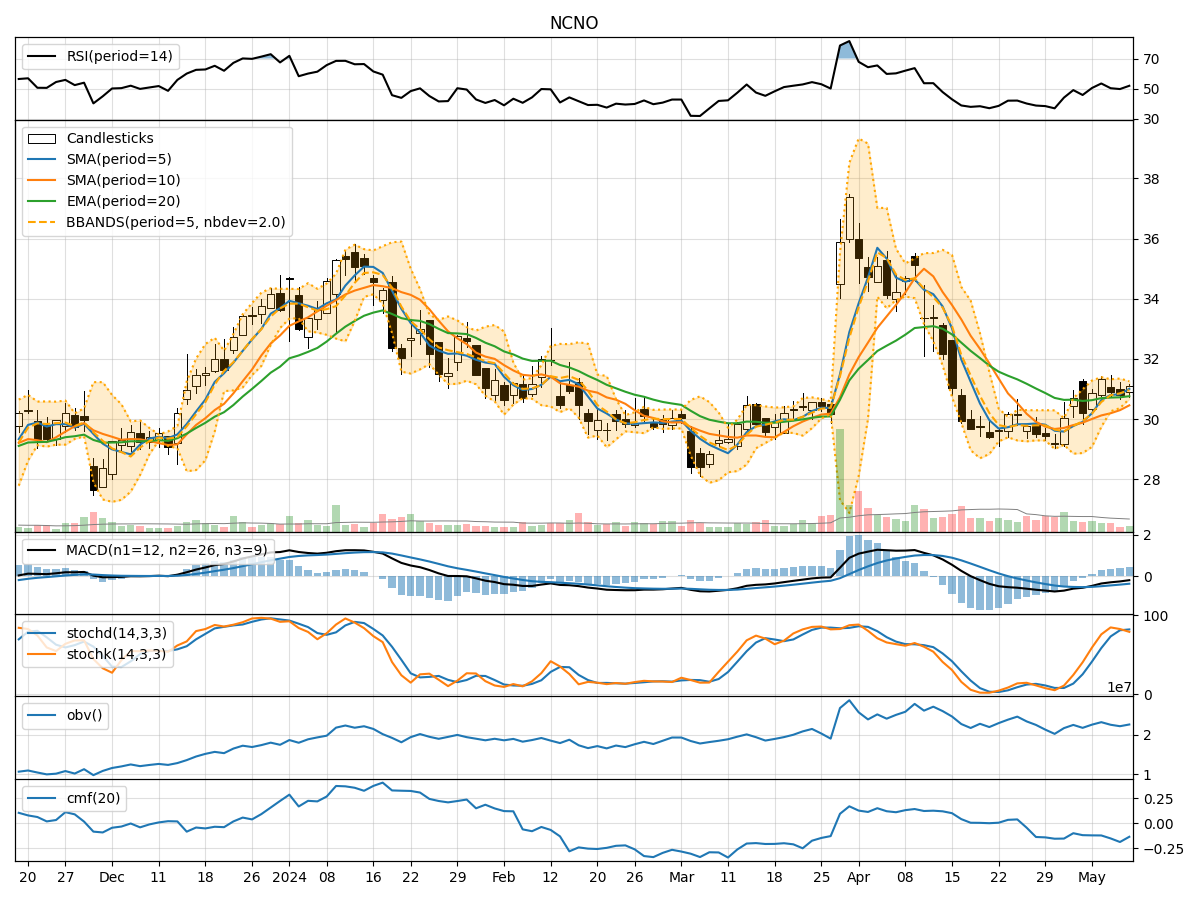
- Moving Averages (MA): The 5-day Moving Average (MA) has been consistently above the Simple Moving Average (SMA) and Exponential Moving Average (EMA), indicating a short-term bullish trend.
- MACD: The MACD line has been consistently below the signal line, suggesting a bearish momentum in the stock price.
- RSI: The Relative Strength Index (RSI) has been fluctuating around the 50 level, indicating a neutral stance in terms of momentum.
Momentum Analysis:
- Stochastic Oscillator: The Stochastic Oscillator has been hovering in the overbought territory, suggesting a potential reversal or consolidation phase.
- Williams %R: The Williams %R indicator has been fluctuating near the oversold region, indicating a possible buying opportunity.
Volatility Analysis:
- Bollinger Bands: The Bollinger Bands have been narrowing, indicating decreasing volatility in the stock price.
- Average True Range (ATR): The ATR has been relatively stable, suggesting consistent price movements without significant spikes.
Volume Analysis:
- On-Balance Volume (OBV): The OBV has been fluctuating, indicating mixed sentiment among investors regarding the stock.
- Chaikin Money Flow (CMF): The CMF has been negative, suggesting outflow of money from the stock.
Key Observations:
- The trend indicators point towards a short-term bullish sentiment, supported by the moving averages.
- Momentum indicators show conflicting signals, with the Stochastic Oscillator indicating overbought conditions and the Williams %R suggesting a potential buying opportunity.
- Volatility has been decreasing, indicating a possible period of consolidation or a lack of significant price movements.
- Volume indicators reflect mixed sentiment, with the OBV fluctuating and the CMF showing negative money flow.
Conclusion:
Based on the analysis of the technical indicators, the next few days for NCNO could see sideways movement or consolidation in the stock price. The conflicting signals from the momentum indicators suggest a lack of clear direction, while decreasing volatility indicates a period of stability. Investors may need to closely monitor key support and resistance levels to gauge the potential breakout or breakdown in the stock price. It is advisable to exercise caution and wait for clearer signals before making significant trading decisions.