Technical Analysis of NCTY 2024-05-10
Overview:
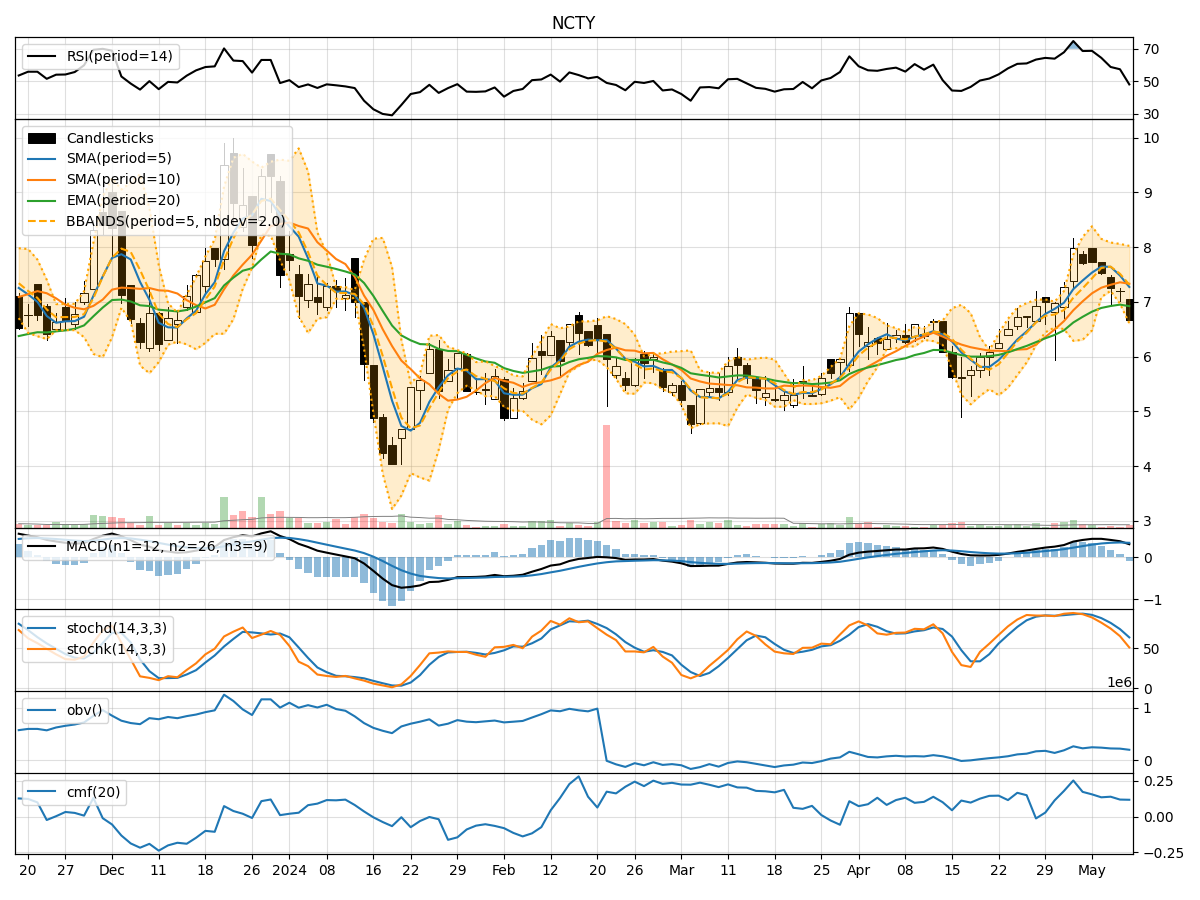
In analyzing the technical indicators for NCTY over the last 5 days, we will delve into the trend, momentum, volatility, and volume indicators to provide a comprehensive outlook on the possible stock price movement in the coming days. By examining these key indicators, we aim to offer valuable insights and predictions for potential investors.
Trend Analysis:
- Moving Averages (MA): The 5-day Moving Average (MA) has been fluctuating around the closing prices, indicating short-term price trends. The Simple Moving Average (SMA) and Exponential Moving Average (EMA) show an overall uptrend, with the EMA slightly above the SMA.
- MACD: The Moving Average Convergence Divergence (MACD) has been positive, suggesting bullish momentum in the stock price.
Momentum Analysis:
- RSI: The Relative Strength Index (RSI) has been declining but remains above 50, indicating a moderate bullish momentum.
- Stochastic Oscillator: Both %K and %D have been decreasing, moving towards oversold territory, suggesting a potential reversal in the short term.
Volatility Analysis:
- Bollinger Bands (BB): The Bollinger Bands have been narrowing, indicating decreasing volatility in the stock price.
Volume Analysis:
- On-Balance Volume (OBV): The OBV has been declining, suggesting a decrease in buying pressure.
- Chaikin Money Flow (CMF): The CMF has been relatively stable, indicating a neutral money flow trend.
Key Observations:
- The stock has shown signs of consolidation with narrowing Bollinger Bands and stable CMF.
- The declining OBV indicates weakening buying pressure.
- The MACD and RSI suggest a mixed sentiment with a slight bullish bias.
- The Stochastic Oscillator points towards a potential short-term reversal.
Conclusion:
Based on the analysis of the technical indicators, the stock price of NCTY is likely to experience further consolidation in the coming days. The narrowing Bollinger Bands and stable CMF indicate a period of indecision and potential range-bound trading. However, the declining OBV and mixed momentum indicators suggest a cautious approach. Investors should closely monitor the price action for any signs of a breakout or reversal before making trading decisions.
Recommendation:
- Short-term Traders: Consider waiting for a clear breakout above the recent highs or below the recent lows before initiating new positions.
- Long-term Investors: Monitor the price action for a potential trend confirmation before making significant investment decisions.
By combining insights from trend, momentum, volatility, and volume indicators, investors can make more informed decisions and adapt their strategies to the evolving market conditions.