Technical Analysis of NDSN 2024-05-10
Overview:
In analyzing the technical indicators for NDSN over the last 5 days, we will delve into the trend, momentum, volatility, and volume indicators to provide a comprehensive outlook on the possible stock price movement. By examining these key aspects, we aim to offer valuable insights and predictions for the upcoming days.
Trend Indicators:
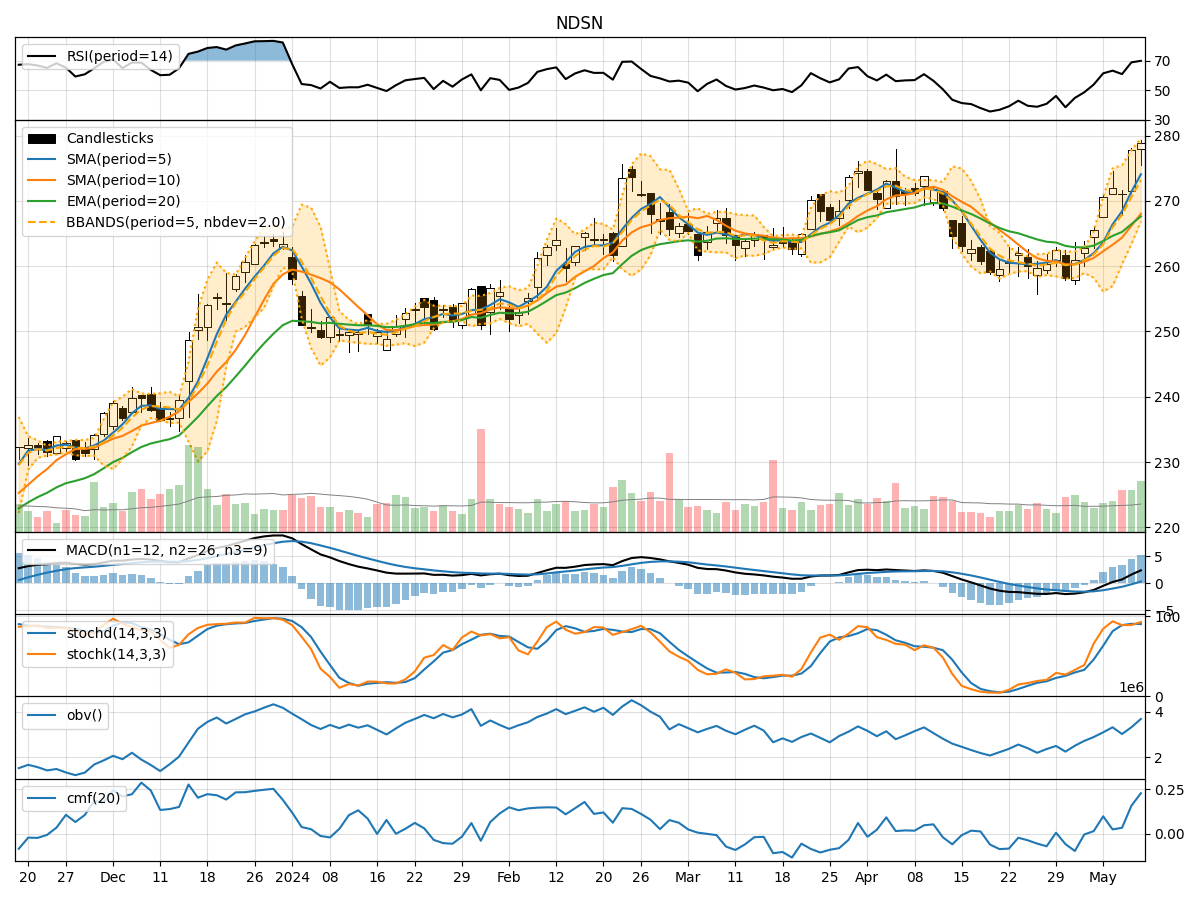
- Moving Averages (MA): The 5-day Moving Average has been consistently above the Simple Moving Average (SMA) and Exponential Moving Average (EMA), indicating a bullish trend.
- MACD: The MACD line has been consistently above the signal line, with both lines showing an upward trend, suggesting bullish momentum.
- Conclusion: The trend indicators point towards an upward trend in the stock price.
Momentum Indicators:
- RSI: The Relative Strength Index (RSI) has been trending upwards, indicating increasing buying pressure.
- Stochastic Oscillator: Both %K and %D have been in the overbought zone, suggesting a strong bullish momentum.
- Conclusion: Momentum indicators signal a bullish sentiment in the stock.
Volatility Indicators:
- Bollinger Bands (BB): The stock price has been consistently trading above the middle Bollinger Band, indicating an uptrend.
- Bollinger %B: The %B indicator has been above 0.5, suggesting bullish momentum.
- Conclusion: Volatility indicators support a bullish outlook for the stock.
Volume Indicators:
- On-Balance Volume (OBV): The OBV has shown mixed signals, with some days experiencing selling pressure and others showing buying interest.
- Chaikin Money Flow (CMF): The CMF has been positive, indicating money flow into the stock.
- Conclusion: Volume indicators are somewhat mixed but overall lean towards a bullish bias.
Overall Conclusion:
Based on the analysis of trend, momentum, volatility, and volume indicators, the collective outlook for NDSN stock is strongly bullish. The trend is upward, momentum is positive, volatility supports an uptrend, and volume indicators, although mixed, also suggest a bullish sentiment. Therefore, the next few days are likely to see the stock price continue its upward trajectory.
Key Takeaways:
- Upward Trend: The stock is in a clear uptrend based on moving averages and MACD.
- Bullish Momentum: Momentum indicators like RSI and Stochastic Oscillator signal strong buying pressure.
- Positive Volatility: Bollinger Bands and %B indicator support a bullish outlook.
- Mixed Volume: While volume indicators are mixed, the overall sentiment remains bullish.
Recommendation:
Considering the overwhelmingly bullish signals from the technical indicators, it is advisable to consider buying NDSN stock for potential short to medium-term gains. Traders and investors may look for entry points during minor pullbacks to capitalize on the upward momentum. However, it is essential to monitor the indicators closely for any signs of reversal or consolidation.