Technical Analysis of NEON 2024-05-10
Overview:
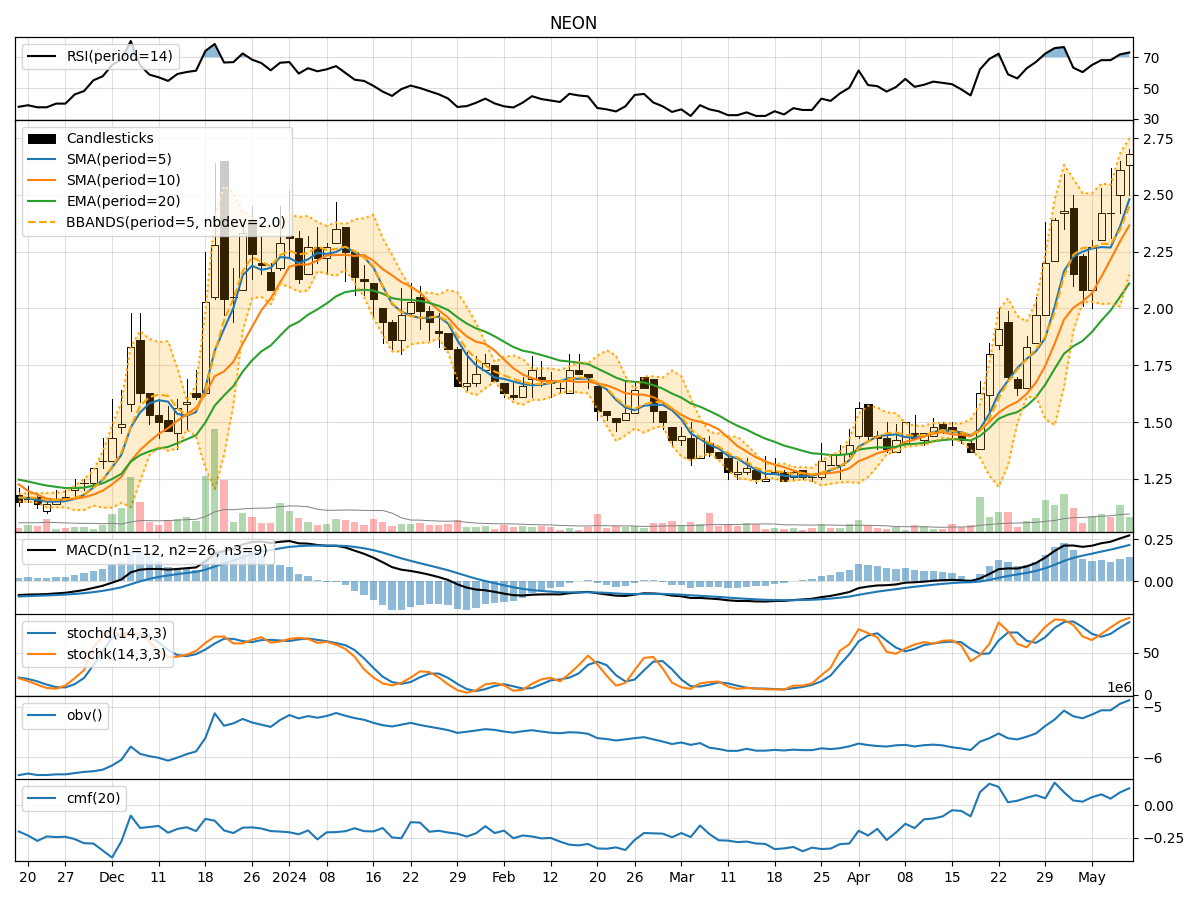
In analyzing the technical indicators for NEON over the last 5 days, we will delve into the trend, momentum, volatility, and volume indicators to provide a comprehensive outlook on the possible stock price movement. By examining these key aspects, we aim to offer valuable insights and predictions for the upcoming days.
Trend Indicators:
- Moving Averages (MA): The 5-day moving average has been consistently increasing, indicating a bullish trend in the short term.
- MACD: The MACD line has been above the signal line, suggesting positive momentum in the stock price.
- EMA: The exponential moving average has been steadily rising, supporting the bullish trend.
Key Observation: The trend indicators point towards a bullish sentiment in the stock price movement.
Momentum Indicators:
- RSI: The Relative Strength Index has been in the overbought territory, indicating strong buying momentum.
- Stochastic Oscillator: Both %K and %D have been in the overbought zone, signaling potential for a pullback.
- Williams %R: The Williams %R is close to the oversold region, suggesting a possible reversal.
Key Observation: Momentum indicators show a mixed signal with potential for a short-term pullback.
Volatility Indicators:
- Bollinger Bands: The stock price has been trading near the upper Bollinger Band, indicating high volatility and a potential overbought condition.
- Bollinger %B: The %B is above 0.8, suggesting the stock is overbought.
- Average True Range (ATR): ATR has increased, indicating higher volatility in the stock.
Key Observation: Volatility indicators suggest a highly volatile market with a potential for a reversal.
Volume Indicators:
- On-Balance Volume (OBV): The OBV has been increasing, indicating strong buying pressure.
- Chaikin Money Flow (CMF): The CMF is positive, reflecting buying interest in the stock.
Key Observation: Volume indicators support the bullish sentiment in the stock price movement.
Conclusion:
Based on the analysis of the technical indicators, the overall outlook for NEON in the next few days is bullish with a potential for a short-term pullback due to overbought conditions indicated by momentum and volatility indicators. Traders should be cautious of a possible reversal in the stock price, especially considering the high volatility and overbought signals. It is advisable to closely monitor the price action and key support levels for any signs of a trend reversal.
Key Conclusion: The stock is likely to experience upward movement in the near term, but traders should be prepared for a potential pullback before resuming the upward trend.