Technical Analysis of NEWT 2024-05-31
Overview:
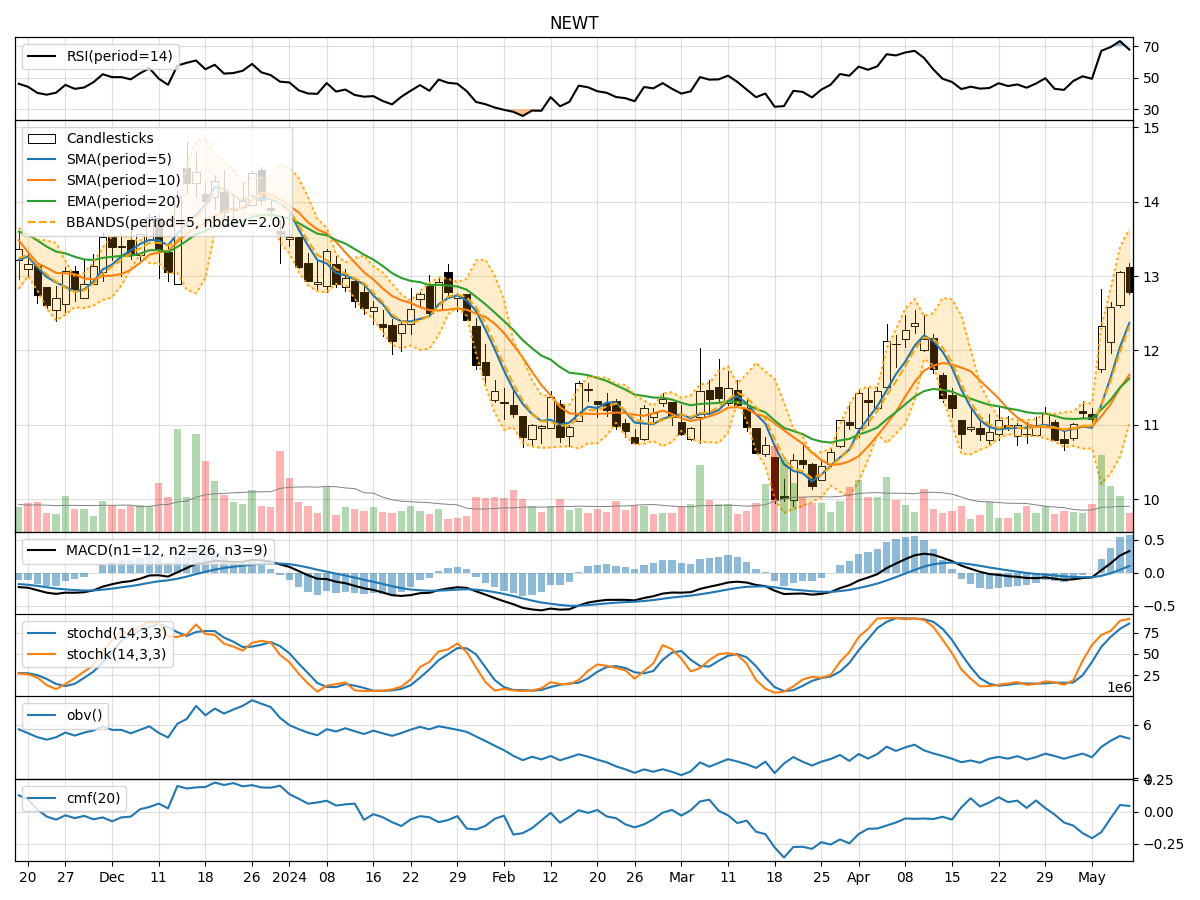
In analyzing the technical indicators for NEWT over the last 5 days, we will delve into the trend, momentum, volatility, and volume indicators to provide a comprehensive outlook on the possible stock price movement in the coming days.
Trend Analysis:
- Moving Averages (MA): The 5-day Moving Average (MA) has been fluctuating around the closing prices, indicating short-term price trends. The Simple Moving Average (SMA) and Exponential Moving Average (EMA) show a slight upward trend, suggesting a potential bullish sentiment.
- MACD: The Moving Average Convergence Divergence (MACD) has been positive but decreasing, indicating a potential slowdown in the bullish momentum.
- MACD Histogram: The MACD Histogram has been negative, suggesting a divergence between the MACD and the signal line.
Momentum Analysis:
- RSI: The Relative Strength Index (RSI) has been fluctuating in the neutral zone, indicating indecision in the market.
- Stochastic Oscillator: Both %K and %D of the Stochastic Oscillator have been declining, signaling a potential bearish momentum.
- Williams %R: The Williams %R is in the oversold territory, suggesting a possible reversal in the short term.
Volatility Analysis:
- Bollinger Bands: The Bollinger Bands have been narrowing, indicating decreasing volatility in the stock price.
- Bollinger %B: The %B indicator has been hovering around the middle band, suggesting a balanced market sentiment.
Volume Analysis:
- On-Balance Volume (OBV): The OBV has been increasing, indicating accumulation by investors.
- Chaikin Money Flow (CMF): The CMF has been positive, suggesting buying pressure in the market.
Key Observations:
- The trend indicators show a potential bullish sentiment in the short term, supported by the moving averages.
- Momentum indicators, however, indicate a weakening bullish momentum and a possible shift towards a bearish sentiment.
- Volatility has been decreasing, indicating a period of consolidation or a potential breakout.
- Volume indicators suggest accumulation and buying pressure in the market.
Conclusion:
Based on the analysis of the technical indicators, the next few days' possible stock price movement for NEWT could be sideways with a slight bearish bias. The conflicting signals from the momentum indicators and the narrowing Bollinger Bands suggest a period of consolidation with a potential downside risk. Traders should closely monitor key support levels and be cautious of a possible trend reversal.