Technical Analysis of NFBK 2024-05-31
Overview:
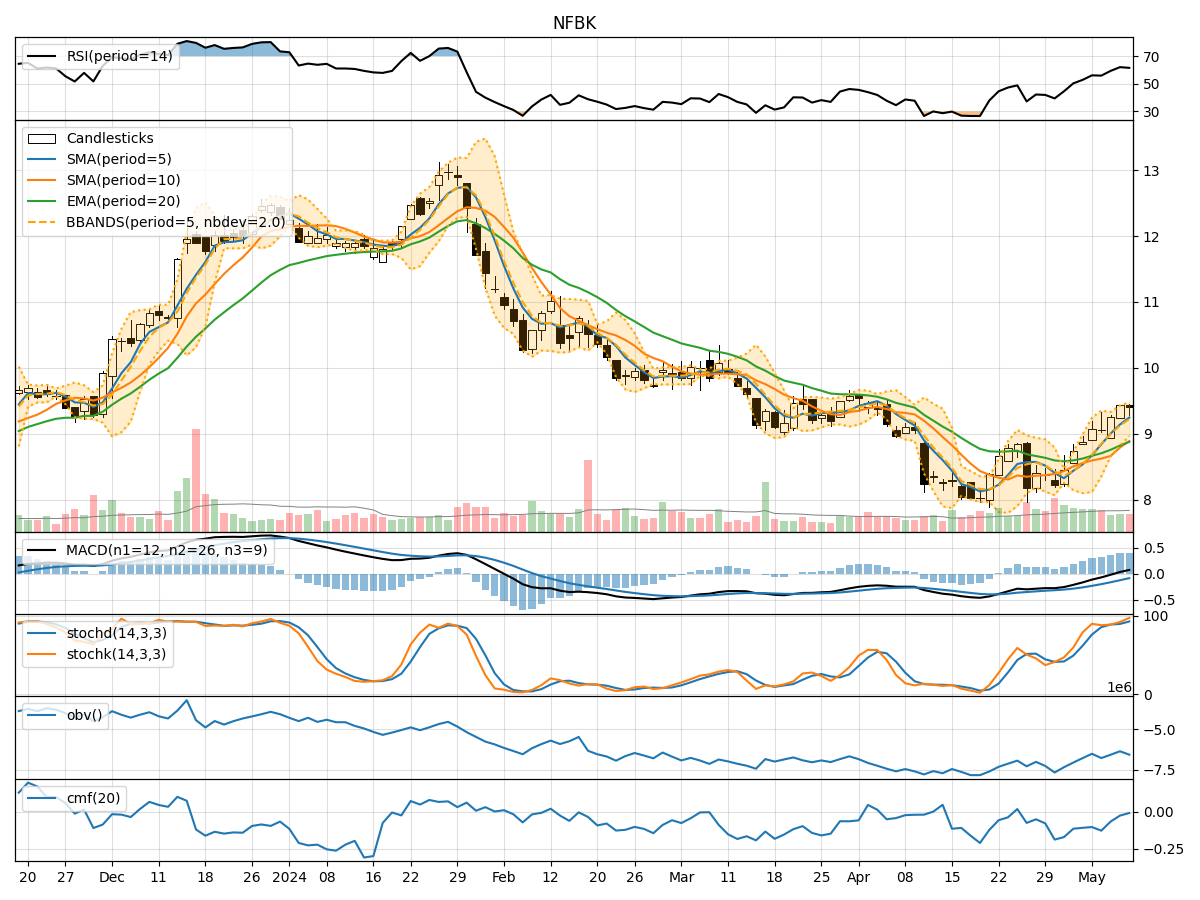
In analyzing the technical indicators for NFBK over the last 5 days, we will delve into the trend, momentum, volatility, and volume indicators to provide a comprehensive outlook on the possible stock price movement. By examining these key aspects, we aim to offer valuable insights and predictions for the upcoming days.
Trend Analysis:
- Moving Averages (MA): The 5-day MA has been consistently below the closing price, indicating a short-term downtrend.
- MACD: The MACD line has been below the signal line, suggesting a bearish momentum.
- EMA: The EMA has been declining, reflecting a weakening trend.
Momentum Analysis:
- RSI: The RSI has been fluctuating around the 40-50 range, indicating a lack of strong momentum.
- Stochastic Oscillator: Both %K and %D have been in oversold territory, signaling a potential reversal.
- Williams %R: The indicator has been consistently in oversold territory, suggesting a bearish sentiment.
Volatility Analysis:
- Bollinger Bands: The price has been trading below the lower Bollinger Band, indicating oversold conditions.
- Bollinger %B: The %B indicator has been below 0.2, signaling potential undervaluation.
- Bollinger Band Width: The Band Width has been widening, indicating increased volatility.
Volume Analysis:
- On-Balance Volume (OBV): The OBV has been fluctuating, reflecting indecision among market participants.
- Chaikin Money Flow (CMF): The CMF has been negative, suggesting outflow of money from the stock.
Conclusion:
Based on the analysis of the technical indicators, the stock of NFBK is currently in a bearish phase. The trend indicators show a downward trajectory, supported by the momentum indicators signaling weakness in momentum. Volatility remains high, indicating potential price swings, while volume indicators reflect a lack of strong buying interest.
Forecast:
Given the current technical outlook, it is likely that NFBK will continue its downward movement in the next few days. Traders and investors should exercise caution and consider shorting or staying on the sidelines until a clear reversal pattern emerges. It is advisable to closely monitor key support levels and wait for bullish confirmation before considering long positions.