Technical Analysis of NICE 2024-05-10
Overview:
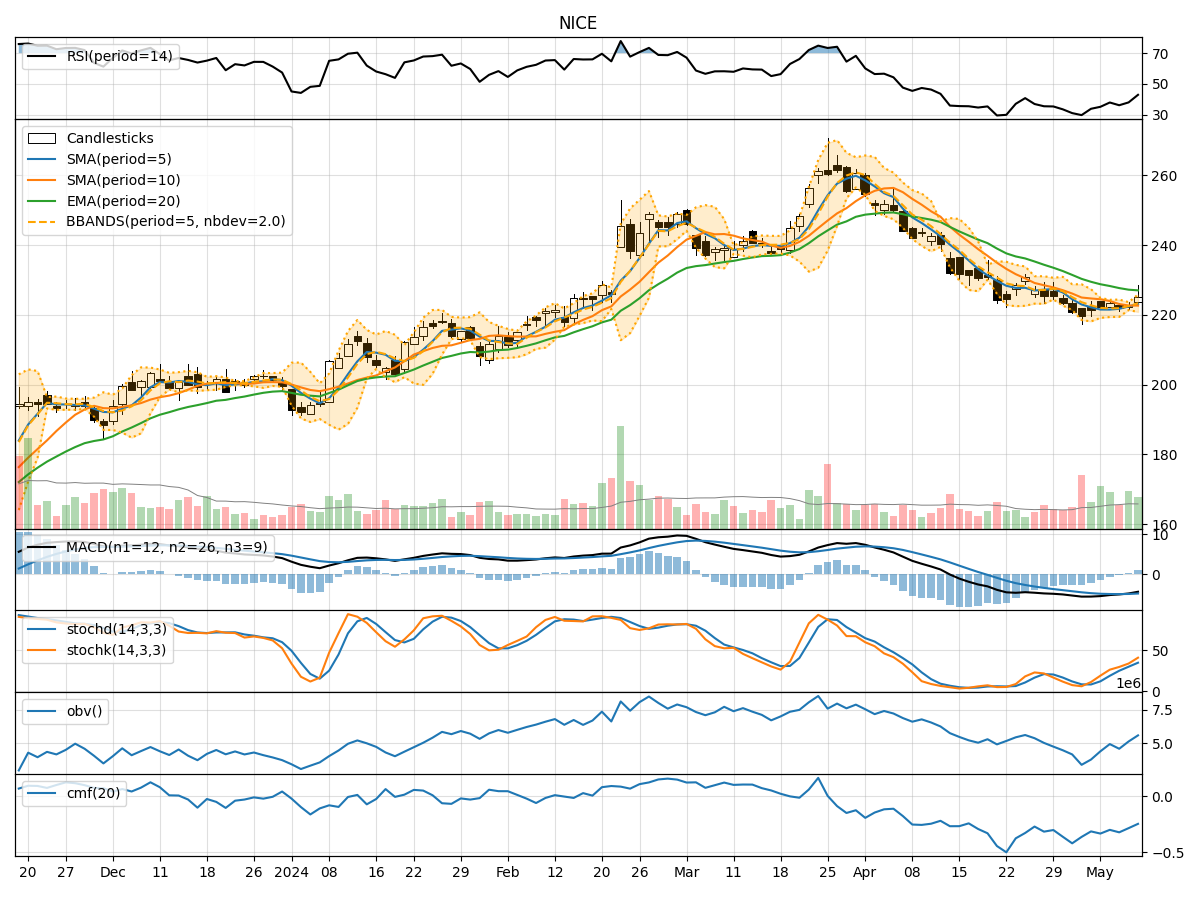
In analyzing the technical indicators for NICE stock over the last 5 days, we will delve into the trend, momentum, volatility, and volume indicators to provide a comprehensive outlook on the possible future stock price movement. By examining these key indicators, we aim to offer valuable insights and recommendations for potential investors.
Trend Indicators:
- Moving Averages (MA): The 5-day MA has been fluctuating around the closing prices, indicating short-term price trends. The SMA(10) and EMA(20) show a downward trend, suggesting a bearish sentiment in the medium to long term.
- MACD: The MACD line has been consistently negative, indicating a bearish trend. The MACD Histogram has been decreasing, signaling a weakening bearish momentum.
Momentum Indicators:
- RSI: The RSI has been below 50, indicating bearish momentum. However, it has been gradually increasing, suggesting a potential reversal in the short term.
- Stochastic Oscillator: Both %K and %D have been rising, indicating increasing buying pressure. The stock may be entering oversold territory based on the %D line.
Volatility Indicators:
- Bollinger Bands (BB): The stock price has been trading within the bands, with the upper band acting as resistance and the lower band as support. The bands are narrowing, indicating decreasing volatility.
- Bollinger %B: The %B has been fluctuating around 0.5, suggesting the stock is trading near the middle of the bands.
Volume Indicators:
- On-Balance Volume (OBV): The OBV has been declining, indicating distribution and selling pressure. This may lead to further downward price movement.
- Chaikin Money Flow (CMF): The CMF has been negative, indicating outflow of money from the stock. This aligns with the bearish sentiment indicated by other indicators.
Conclusion:
Based on the analysis of the technical indicators, the stock is currently in a bearish phase. The trend indicators show a downward trajectory, supported by the negative MACD and declining moving averages. Momentum indicators suggest a potential short-term reversal, but the overall sentiment remains bearish. Volatility is decreasing, indicating a possible period of consolidation. Volume indicators confirm the selling pressure and lack of buying interest.
Recommendation:
Considering the bearish outlook and the lack of strong bullish signals, it is advisable to exercise caution when considering a long position in NICE stock. Traders may look for short-term opportunities based on potential momentum shifts, but investors should wait for more definitive signs of a trend reversal before entering a long position. Monitoring key support and resistance levels, as well as any significant news or market developments, will be crucial in making informed trading decisions.