Technical Analysis of NITO 2024-05-10
Overview:
In analyzing the technical indicators for NITO stock over the last 5 days, we will delve into the trend, momentum, volatility, and volume indicators to provide a comprehensive outlook on the possible stock price movement in the upcoming days. By examining these key indicators, we aim to offer valuable insights and predictions for potential investors and traders.
Trend Analysis:
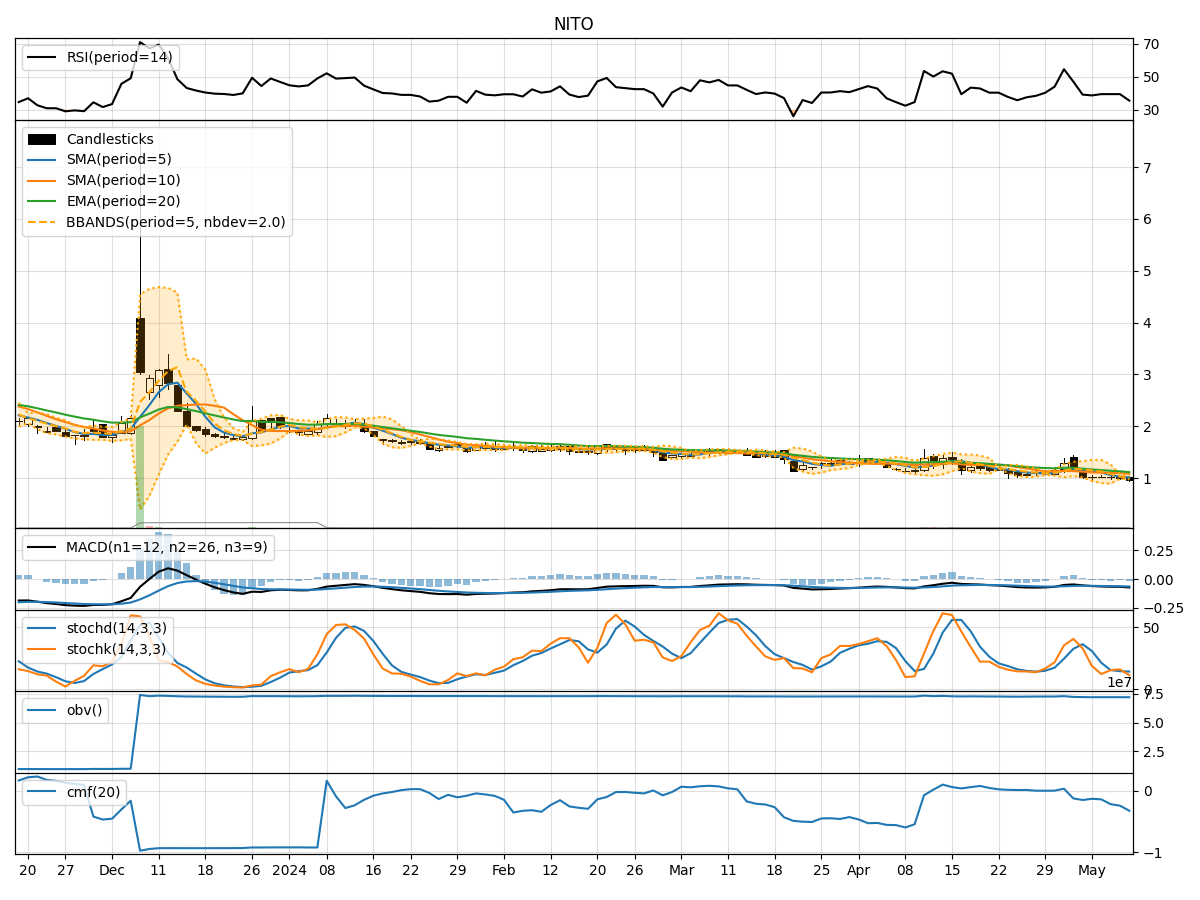
- Moving Averages (MA): The 5-day Moving Average (MA) has been consistently below the closing prices, indicating a downward trend in the short term.
- MACD and Signal Line: The MACD line has been below the Signal line for the past 5 days, suggesting a bearish momentum in the stock.
- Relative Strength Index (RSI): The RSI has been hovering around 35-40, indicating a slightly oversold condition but still within bearish territory.
Momentum Analysis:
- Stochastic Oscillator: Both %K and %D of the Stochastic Oscillator have been decreasing, signaling a bearish momentum.
- Williams %R (Willr): The Williams %R has been consistently in the oversold territory, indicating a strong bearish sentiment.
Volatility Analysis:
- Bollinger Bands (BB): The stock price has been consistently trading below the lower Bollinger Band, suggesting an oversold condition and potential for a reversal.
- Bollinger Band Width (BBW): The Bollinger Band Width has been narrowing, indicating decreasing volatility in the stock.
Volume Analysis:
- On-Balance Volume (OBV): The OBV has been consistently declining, indicating selling pressure in the stock.
- Chaikin Money Flow (CMF): The CMF has been negative for the past 5 days, indicating a bearish money flow trend.
Key Observations and Opinions:
- The stock is currently in a downtrend based on moving averages and MACD analysis.
- Momentum indicators such as Stochastic Oscillator and Williams %R suggest a strong bearish sentiment in the market.
- Volatility has been decreasing, which could indicate a potential reversal or consolidation phase.
- The negative OBV and CMF values point towards continued selling pressure in the stock.
Conclusion:
Based on the analysis of the technical indicators, the next few days for NITO stock are likely to see further downward movement. The bearish trend, coupled with strong momentum indicators and negative volume trends, suggest that the stock is currently in a bearish phase. Traders and investors should exercise caution and consider waiting for signs of a potential reversal or consolidation before considering any long positions.