Technical Analysis of NIU 2024-05-10
Overview:
In analyzing the technical indicators for NIU over the last 5 days, we will delve into the trend, momentum, volatility, and volume indicators to provide a comprehensive outlook on the possible stock price movement in the coming days.
Trend Indicators:
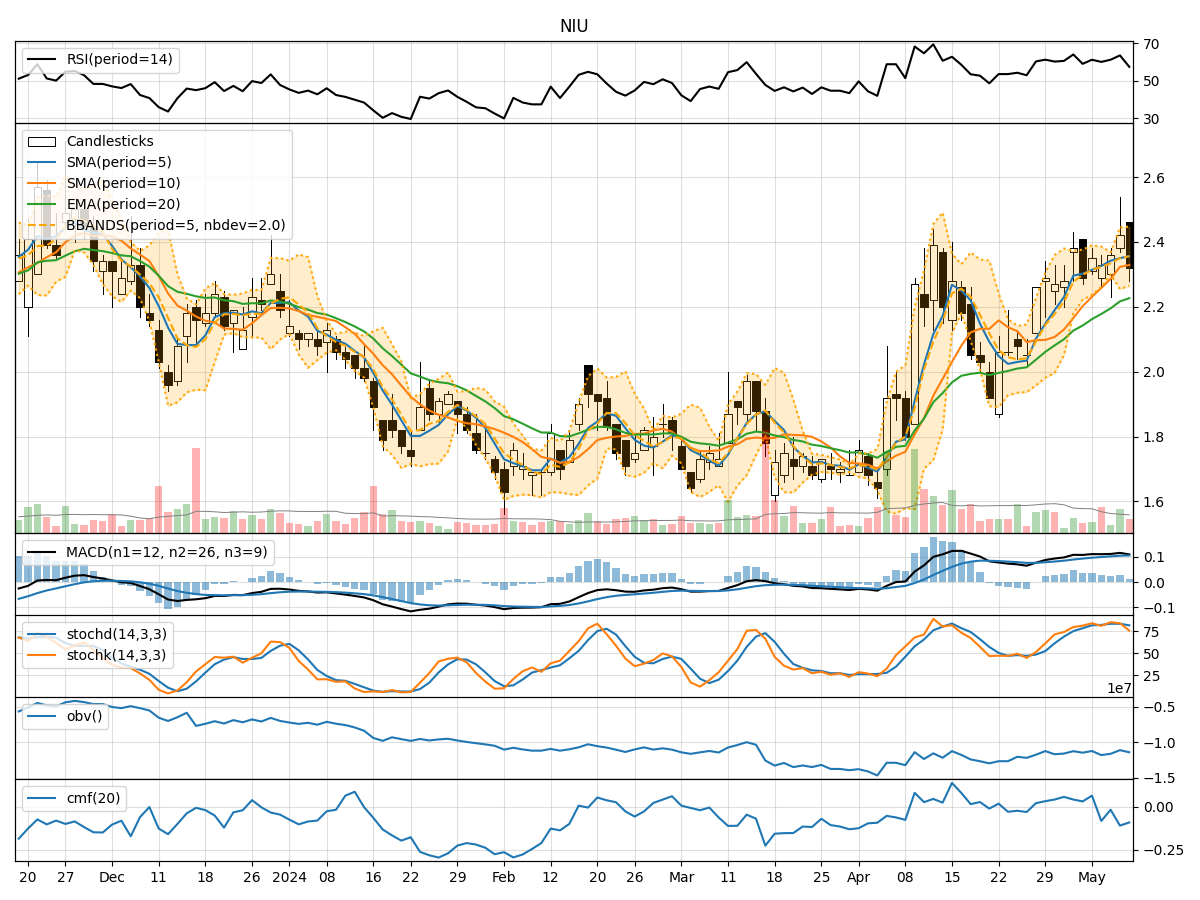
- Moving Averages (MA): The 5-day MA has been consistently above the closing prices, indicating a short-term uptrend.
- MACD: The MACD line has been positive, with the MACD histogram showing an increasing trend, suggesting bullish momentum.
- EMA: The EMA has been steadily rising, reflecting a positive trend in the stock price.
Momentum Indicators:
- RSI: The RSI has been fluctuating around the 60-65 range, indicating moderate momentum.
- Stochastic Oscillator: Both %K and %D have been in the overbought zone, suggesting a potential reversal or consolidation.
- Williams %R: The indicator has been in the oversold territory, signaling a possible buying opportunity.
Volatility Indicators:
- Bollinger Bands: The stock price has been trading within the bands, with the %B indicator hovering around the midpoint, indicating neutral volatility.
- Average True Range (ATR): The ATR has shown relatively stable volatility levels over the past few days.
Volume Indicators:
- On-Balance Volume (OBV): The OBV has been fluctuating, indicating mixed buying and selling pressure.
- Chaikin Money Flow (CMF): The CMF has been negative, suggesting a bearish money flow in the stock.
Key Observations and Opinions:
- Trend: The stock is in an upward trend based on moving averages and MACD.
- Momentum: Momentum indicators suggest a mixed outlook with potential for a reversal or consolidation.
- Volatility: Volatility remains neutral based on Bollinger Bands and ATR.
- Volume: The volume indicators show mixed signals with fluctuating OBV and negative CMF.
Conclusion:
Based on the analysis of technical indicators, the next few days for NIU stock could see further upside potential in the stock price, supported by the positive trend indicators. However, caution is advised as momentum indicators signal a potential reversal or consolidation. Volatility is expected to remain stable, while volume indicators suggest mixed investor sentiment. Traders and investors should closely monitor key levels and wait for confirmation before making trading decisions.