Technical Analysis of NMHI 2024-05-31
Overview:
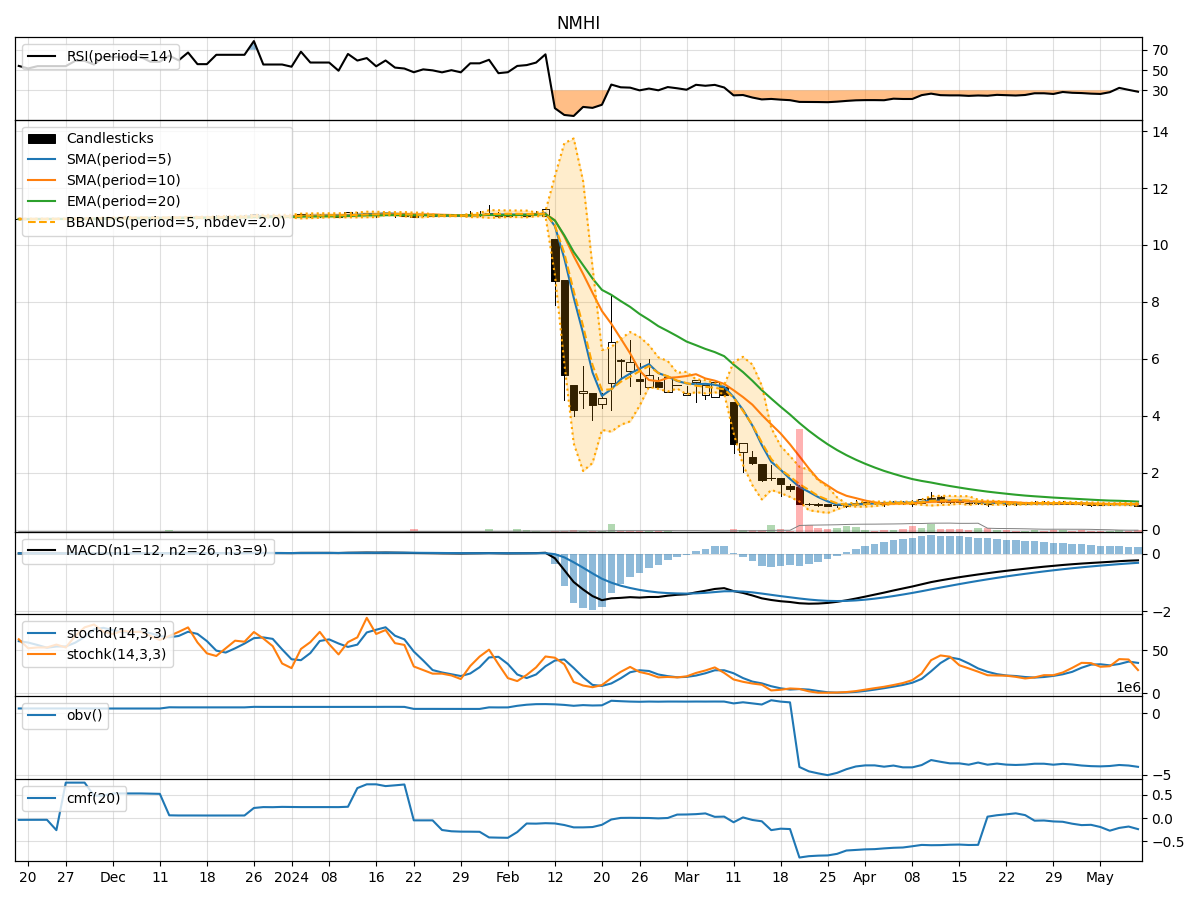
In analyzing the technical indicators for NMHI over the last 5 days, we will delve into the trend, momentum, volatility, and volume indicators to provide a comprehensive outlook on the possible stock price movement. By examining these key aspects, we aim to offer valuable insights and predictions for the upcoming days.
Trend Analysis:
- Moving Averages (MA): The 5-day Moving Average (MA) has been showing an upward trend, indicating a positive momentum in the stock price.
- MACD: The Moving Average Convergence Divergence (MACD) has been consistently improving, with the MACD line moving closer to the signal line, suggesting a potential bullish signal.
- EMA: The Exponential Moving Average (EMA) has been declining slightly, but the overall trend remains positive.
Momentum Analysis:
- RSI: The Relative Strength Index (RSI) has been gradually increasing, indicating strengthening momentum in the stock price.
- Stochastic Oscillator: Both %K and %D lines of the Stochastic Oscillator have been rising, signaling a bullish momentum.
- Williams %R: The Williams %R indicator has been moving towards oversold territory, suggesting a potential buying opportunity.
Volatility Analysis:
- Bollinger Bands (BB): The Bollinger Bands have been narrowing, indicating decreasing volatility in the stock price.
- BB %B: The %B indicator has been fluctuating within a tight range, reflecting stable price movements.
- BB Width: The Bollinger Bands Width has been contracting, suggesting a potential breakout or significant price movement ahead.
Volume Analysis:
- On-Balance Volume (OBV): The OBV indicator has been fluctuating, indicating mixed sentiment among investors.
- Chaikin Money Flow (CMF): The CMF has been negative, suggesting that money is flowing out of the stock.
Conclusion:
Based on the analysis of the technical indicators, the stock of NMHI is likely to experience further upward movement in the coming days. The positive trends in moving averages, MACD, RSI, and Stochastic Oscillator indicate a bullish sentiment. Although volatility has been decreasing, the narrowing Bollinger Bands Width could precede a breakout. The mixed volume indicators suggest caution, but the overall momentum and trend signals point towards a bullish outlook for NMHI. Traders and investors may consider entering long positions or holding onto existing positions to capitalize on the potential price appreciation.