Technical Analysis of NNOX 2024-05-10
Overview:
In analyzing the technical indicators for NNOX over the last 5 days, we will delve into the trend, momentum, volatility, and volume indicators to provide a comprehensive outlook on the possible stock price movement in the coming days. By examining these key aspects, we aim to offer valuable insights and predictions to guide your investment decisions.
Trend Indicators:
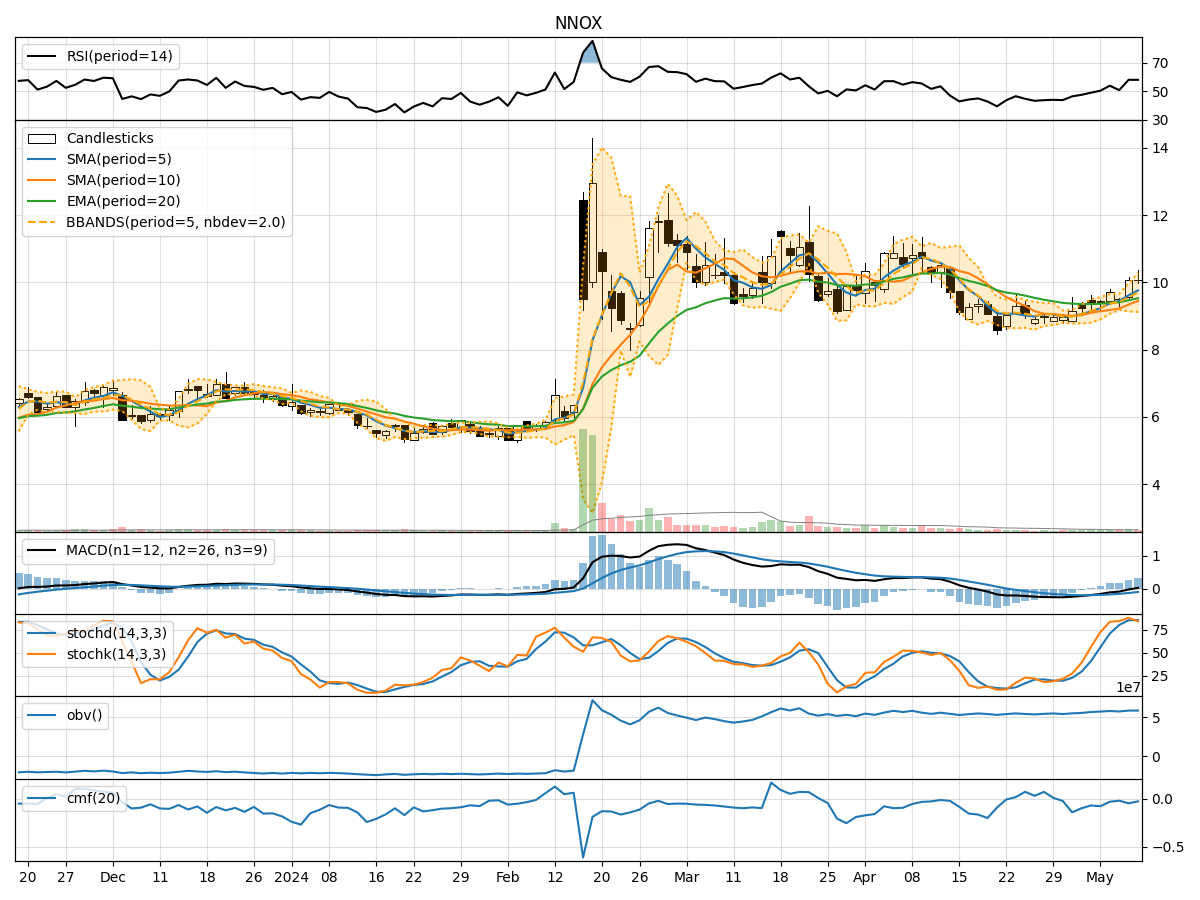
- Moving Averages (MA): The 5-day MA has been consistently above the closing prices, indicating a short-term uptrend.
- MACD: The MACD line has been gradually increasing, with the MACD histogram showing positive values, suggesting bullish momentum.
- Relative Strength Index (RSI): The RSI has been fluctuating around the 50 level, indicating a neutral stance.
Key Observation: The trend indicators suggest a bullish sentiment in the short term.
Momentum Indicators:
- Stochastic Oscillator: Both %K and %D have been in the overbought territory, signaling potential for a pullback.
- Williams %R: The indicator has been hovering in the oversold region, indicating a possible reversal.
Key Observation: Momentum indicators point towards a potential reversal or consolidation phase.
Volatility Indicators:
- Bollinger Bands (BB): The price has been trading within the bands, with the bands widening, indicating increased volatility.
- Bollinger %B: The %B indicator has been fluctuating, suggesting potential price reversals.
Key Observation: Volatility is on the rise, which could lead to significant price movements.
Volume Indicators:
- On-Balance Volume (OBV): The OBV has been relatively stable, indicating a balance between buying and selling pressure.
- Chaikin Money Flow (CMF): The CMF has been negative, suggesting outflow of money from the stock.
Key Observation: Volume indicators reflect a neutral to bearish sentiment in terms of buying pressure.
Conclusion:
Based on the analysis of the technical indicators, the next few days for NNOX could see sideways movement with a potential for a slight pullback. The trend indicators support a bullish outlook in the short term, while momentum indicators hint at a possible reversal or consolidation phase. The increasing volatility may lead to significant price swings, while volume indicators suggest a lack of strong buying interest. Therefore, it is advisable to exercise caution and closely monitor the price action for any signs of a trend reversal or continuation.