Technical Analysis of NOVV 2024-05-10
Overview:
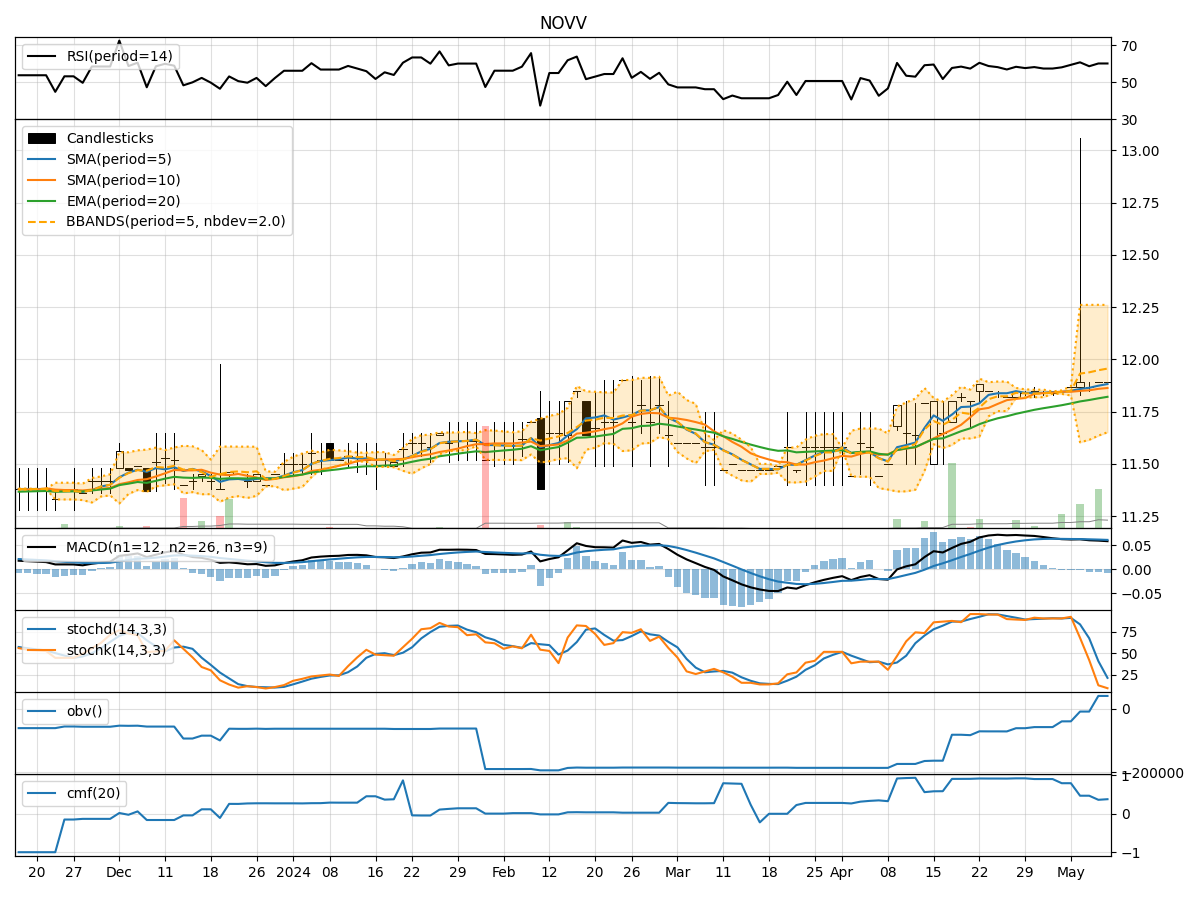
In analyzing the technical indicators for NOVV over the last 5 days, we will delve into the trend, momentum, volatility, and volume indicators to provide a comprehensive outlook on the possible stock price movement in the coming days.
Trend Analysis:
- Moving Averages (MA): The 5-day Moving Average (MA) has been steadily increasing, indicating a positive trend in the short term.
- MACD: The Moving Average Convergence Divergence (MACD) has shown a slight decrease in the MACD line compared to the Signal line, suggesting a potential weakening of the bullish momentum.
- EMA: The Exponential Moving Average (EMA) has been on an upward trajectory, supporting the bullish sentiment in the market.
Momentum Analysis:
- RSI: The Relative Strength Index (RSI) has been fluctuating around the 60 level, indicating a neutral momentum in the stock.
- Stochastic Oscillator: Both %K and %D levels of the Stochastic Oscillator have been declining, signaling a potential bearish momentum.
- Williams %R: The Williams %R is in the oversold territory, suggesting a possible reversal in the stock price.
Volatility Analysis:
- Bollinger Bands: The Bollinger Bands have shown a narrowing of the bands, indicating decreasing volatility in the stock.
- Bollinger %B: The %B indicator is hovering around 0.7, suggesting a neutral stance in terms of volatility.
Volume Analysis:
- On-Balance Volume (OBV): The OBV indicator has been relatively flat, indicating a balance between buying and selling pressure.
- Chaikin Money Flow (CMF): The CMF has been positive but declining, suggesting a decrease in buying pressure.
Conclusion:
Based on the analysis of the technical indicators, the stock of NOVV is likely to experience sideways movement in the coming days. The trend indicators show a mixed signal with a slight bullish bias, while the momentum indicators point towards a potential bearish momentum. Volatility is decreasing, indicating a possible consolidation phase, and volume indicators suggest a balance between buyers and sellers. Therefore, it is recommended to exercise caution and closely monitor the price action for any potential shifts in market sentiment before making any trading decisions.