Technical Analysis of NRDS 2024-05-10
Overview:
In analyzing the provided technical indicators for the last 5 days, we will delve into the trend, momentum, volatility, and volume indicators to forecast the possible stock price movement for the next few days. By examining these key aspects, we aim to provide a comprehensive and insightful analysis to guide your decision-making process.
Trend Indicators:
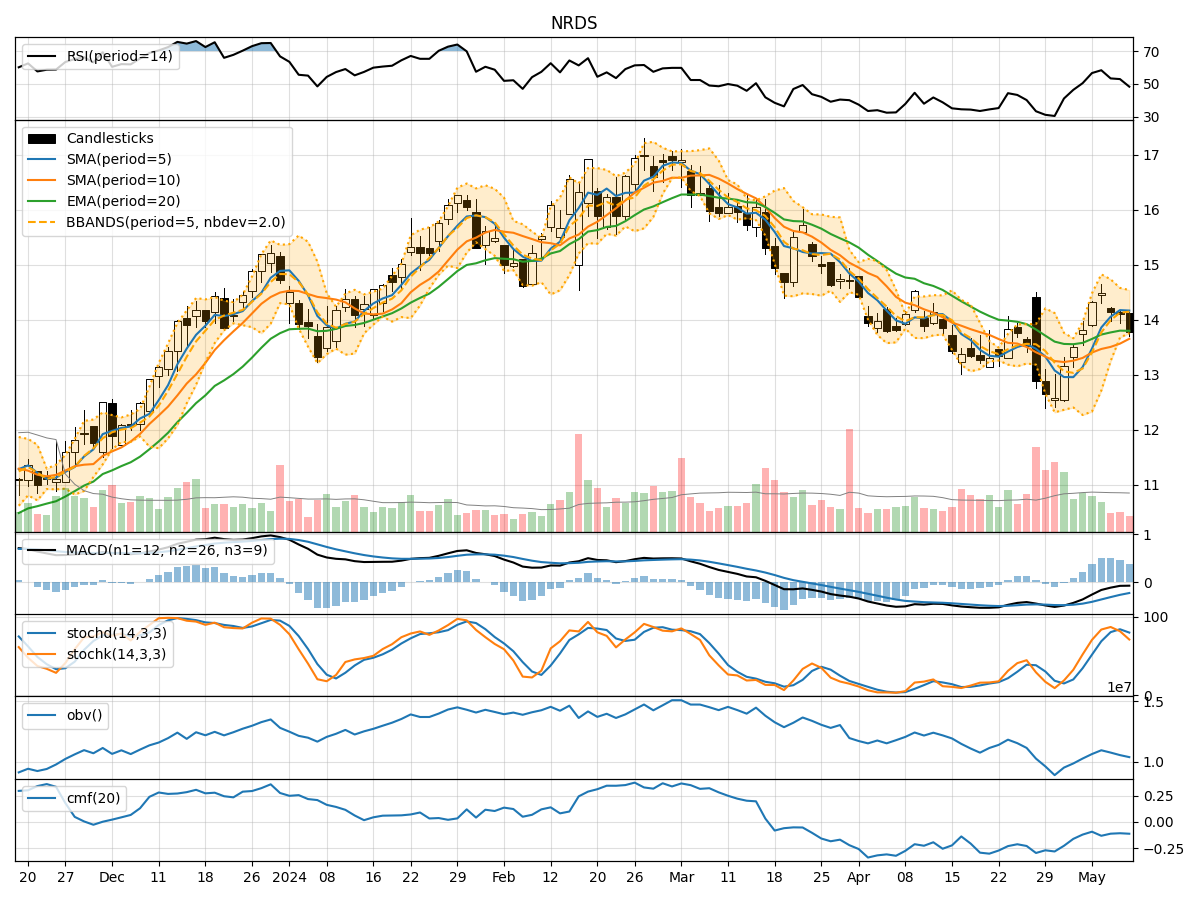
- Moving Averages (MA): The 5-day moving average has been consistently above the closing prices, indicating a short-term uptrend.
- MACD: The MACD line has been negative but converging towards the signal line, suggesting a potential reversal in the downtrend.
- RSI: The RSI has been fluctuating around the neutral zone, indicating indecision in the market sentiment.
Momentum Indicators:
- Stochastic Oscillator: The stochastic indicators have been in overbought territory, signaling a potential reversal or consolidation.
- Williams %R: The Williams %R has been in oversold territory, indicating a possible buying opportunity.
Volatility Indicators:
- Bollinger Bands: The stock price has been trading within the Bollinger Bands, suggesting a period of consolidation or range-bound movement.
- Volatility: The volatility has been decreasing, indicating a potential decrease in price fluctuations.
Volume Indicators:
- On-Balance Volume (OBV): The OBV has been declining, suggesting selling pressure in the market.
- Chaikin Money Flow (CMF): The CMF has been negative, indicating a lack of buying interest.
Key Observations and Opinions:
- Trend: The short-term trend is slightly bullish, but the MACD signals a potential reversal.
- Momentum: The stochastic indicators and Williams %R suggest a possible reversal or consolidation.
- Volatility: The Bollinger Bands and decreasing volatility point towards a period of consolidation.
- Volume: The declining OBV and negative CMF indicate a lack of strong buying interest.
Conclusion:
Based on the analysis of the technical indicators, the stock is likely to experience sideways movement or consolidation in the next few days. The conflicting signals from the trend, momentum, volatility, and volume indicators suggest a period of indecision in the market. It is advisable to closely monitor the price action and wait for clearer signals before making any significant trading decisions.