Technical Analysis of NRSN 2024-05-10
Overview:
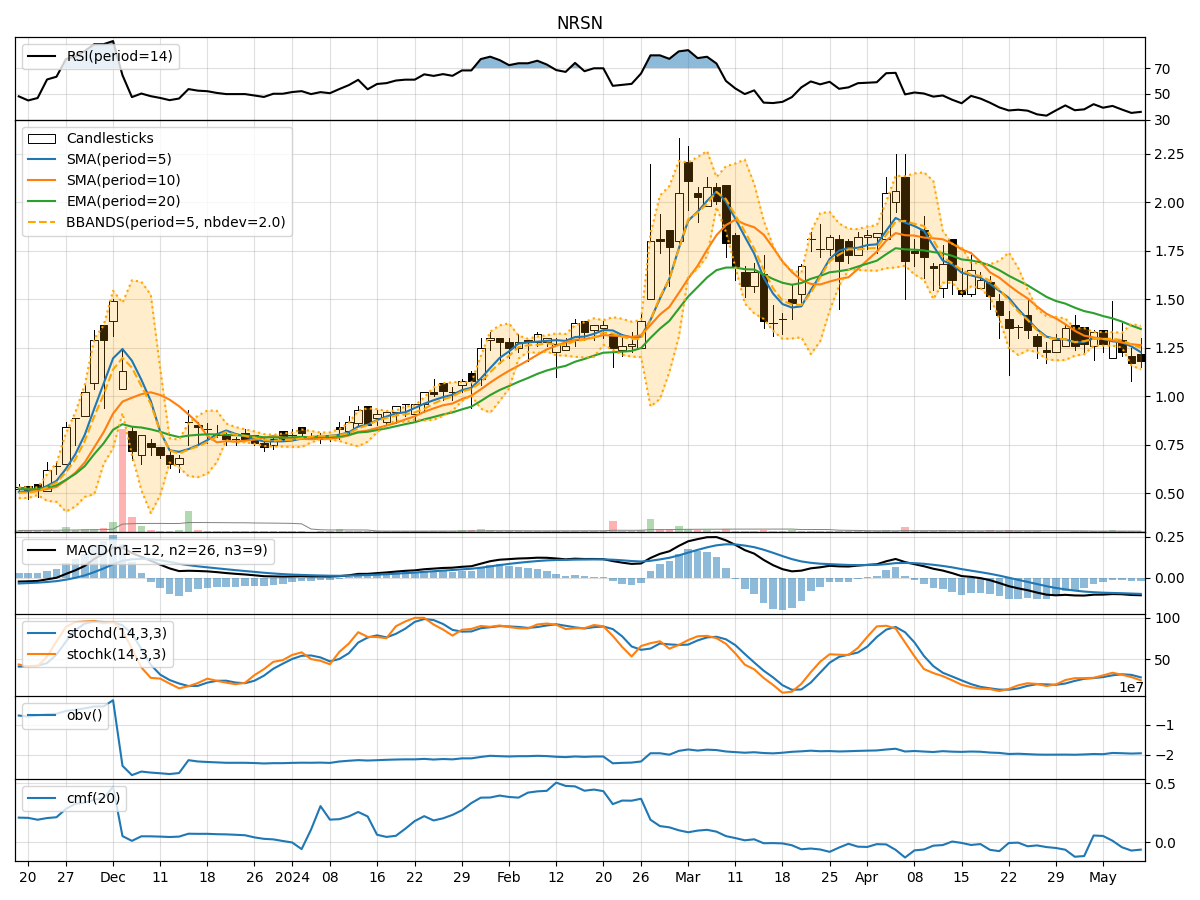
In analyzing the technical indicators for NRSN over the last 5 days, we will delve into the trend, momentum, volatility, and volume indicators to provide a comprehensive outlook on the possible stock price movement. By examining these key aspects, we aim to offer valuable insights and predictions for the upcoming days.
Trend Analysis:
- Moving Averages (MA): The 5-day MA has been consistently decreasing, indicating a downward trend in the stock price.
- MACD: The MACD line has been below the signal line, suggesting a bearish momentum in the stock.
- EMA: The EMA has been declining, further supporting the bearish trend in the stock.
Momentum Analysis:
- RSI: The RSI has been relatively low, indicating potential oversold conditions in the stock.
- Stochastic Oscillator: Both %K and %D have been decreasing, signaling a bearish momentum.
- Williams %R: The Williams %R is in the oversold territory, suggesting a potential reversal or bounce.
Volatility Analysis:
- Bollinger Bands (BB): The stock price has been trading below the middle Bollinger Band, indicating a bearish sentiment.
- BB Width: The Bollinger Bands width has been narrowing, suggesting a decrease in volatility.
- BB %B: The %B indicator is below 0.5, indicating a bearish trend.
Volume Analysis:
- On-Balance Volume (OBV): The OBV has been fluctuating, indicating indecision among investors.
- Chaikin Money Flow (CMF): The CMF has been negative, suggesting selling pressure in the stock.
Key Observations:
- The stock is currently in a downtrend based on moving averages and MACD.
- Momentum indicators like RSI and Stochastic Oscillator suggest oversold conditions.
- Volatility is decreasing, indicating a lack of significant price movements.
- Volume indicators show mixed signals with fluctuating OBV and negative CMF.
Conclusion:
Based on the analysis of technical indicators, the next few days for NRSN are likely to see further downward movement in the stock price. The bearish trend indicated by moving averages and MACD, coupled with oversold conditions in momentum indicators, suggest a continuation of the current downtrend. Investors should exercise caution and consider potential short-term selling opportunities or wait for signs of a reversal before considering long positions.