Technical Analysis of NTNX 2024-05-10
Overview:
In analyzing the technical indicators for NTNX over the last 5 days, we will delve into the trend, momentum, volatility, and volume indicators to provide a comprehensive outlook on the possible stock price movement. By examining these key aspects, we aim to offer valuable insights and predictions for the upcoming days.
Trend Indicators:
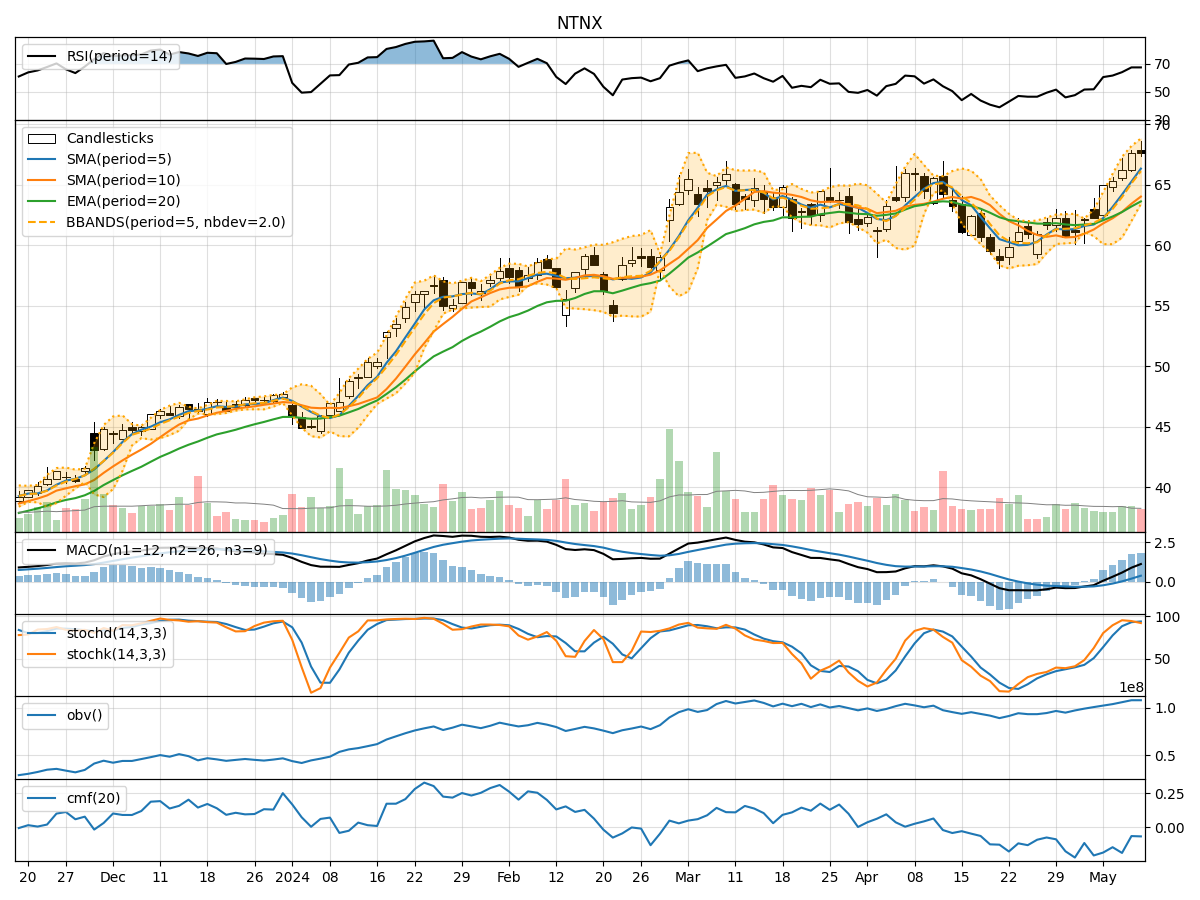
- Moving Averages (MA): The 5-day MA has been consistently rising, indicating a bullish trend in the short term.
- MACD: The MACD line has been above the signal line, suggesting positive momentum in the stock price.
- MACD Histogram: The histogram has been increasing, indicating strengthening bullish momentum.
Momentum Indicators:
- RSI: The RSI has been in the overbought territory, signaling a strong bullish momentum.
- Stochastic Oscillator: Both %K and %D have been in the overbought zone, indicating a potential reversal or consolidation.
- Williams %R: The indicator has been in the oversold region, suggesting a possible reversal to the upside.
Volatility Indicators:
- Bollinger Bands (BB): The stock price has been trading above the upper Bollinger Band, indicating overbought conditions.
- Bollinger Band Width: The band width has been narrowing, suggesting a potential decrease in volatility.
- Bollinger Band %B: The %B indicator has been above 0.8, indicating an overbought condition.
Volume Indicators:
- On-Balance Volume (OBV): The OBV has been relatively flat, indicating a lack of strong buying or selling pressure.
- Chaikin Money Flow (CMF): The CMF has been negative, suggesting a bearish money flow in the stock.
Key Observations:
- The trend indicators suggest a strong bullish sentiment in the short term.
- Momentum indicators show overbought conditions, indicating a potential reversal or consolidation.
- Volatility indicators point towards overbought conditions and decreasing volatility.
- Volume indicators reflect a lack of significant buying or selling pressure.
Conclusion:
Based on the analysis of the technical indicators, the next few days' possible stock price movement for NTNX could see a short-term consolidation or a slight pullback. The stock has exhibited strong bullish momentum but is currently in overbought territory, suggesting a potential reversal or period of consolidation. Traders may consider taking profits or waiting for a better entry point before considering long positions. It is essential to monitor key support and resistance levels for potential trend reversals.