Technical Analysis of NUKK 2024-05-31
Overview:
In analyzing the technical indicators for NUKK stock over the last 5 days, we will delve into the trend, momentum, volatility, and volume indicators to provide a comprehensive outlook on the possible stock price movement in the coming days. By examining these key indicators, we aim to offer valuable insights and predictions for potential investors.
Trend Analysis:
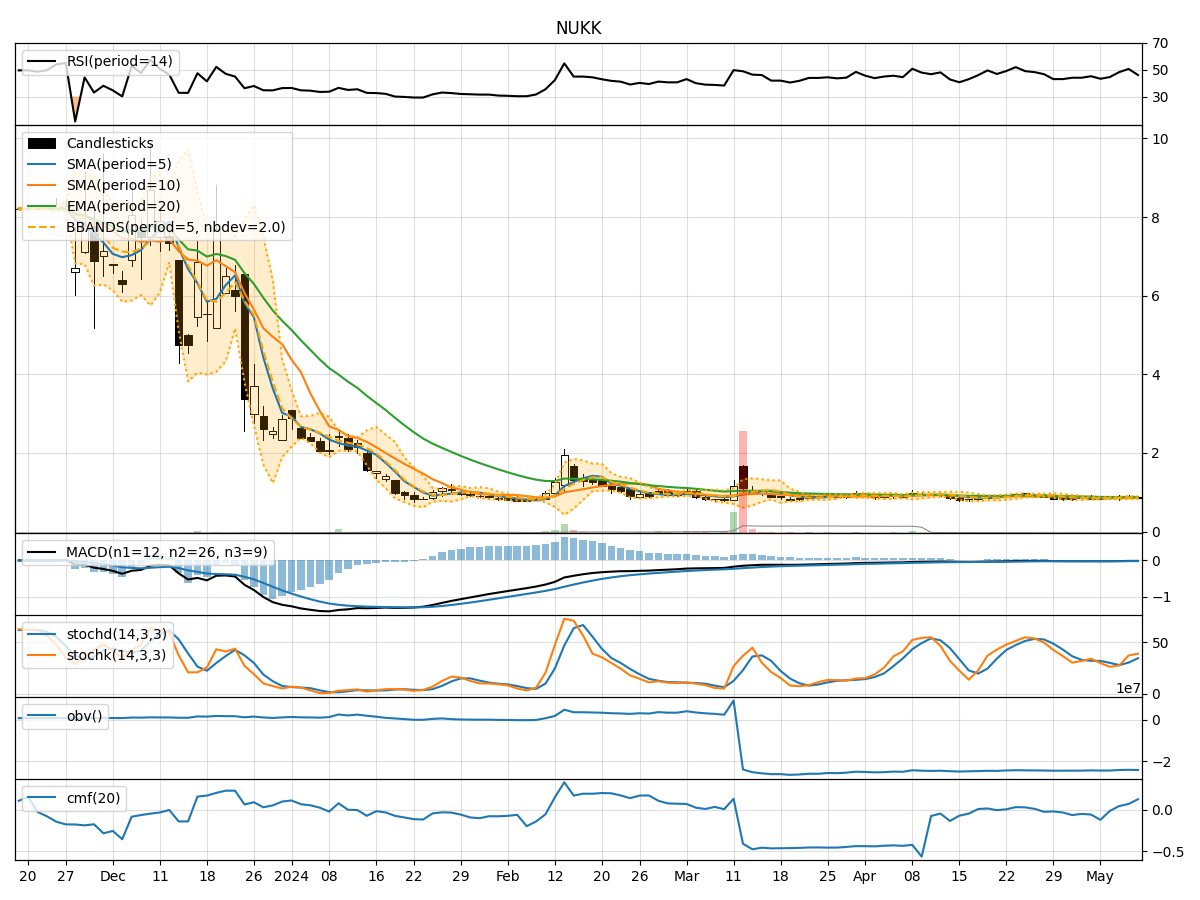
- Moving Averages (MA): The 5-day Moving Average (MA) has been fluctuating around the closing prices, indicating short-term price trends. The Simple Moving Average (SMA) and Exponential Moving Average (EMA) have shown a slight divergence, suggesting potential price volatility.
- MACD: The Moving Average Convergence Divergence (MACD) has been negative, with the MACD line below the signal line, indicating a bearish trend in the short term.
Momentum Analysis:
- RSI: The Relative Strength Index (RSI) has been hovering around 50, indicating a neutral momentum in the stock.
- Stochastic Oscillator: Both %K and %D have been fluctuating in the oversold territory, suggesting a potential reversal in the stock's momentum.
- Williams %R: The Williams %R has been consistently in the oversold region, indicating a bearish sentiment.
Volatility Analysis:
- Bollinger Bands (BB): The Bollinger Bands have been narrowing, indicating decreasing volatility in the stock price.
- Bollinger %B: The %B indicator has been fluctuating around 0.5, suggesting a neutral stance in terms of volatility.
Volume Analysis:
- On-Balance Volume (OBV): The OBV has been negative, indicating selling pressure in the stock.
- Chaikin Money Flow (CMF): The CMF has been consistently negative, reflecting a bearish sentiment among investors.
Key Observations:
- The stock is currently in a consolidation phase, with mixed signals from the trend and momentum indicators.
- Volatility has been decreasing, indicating a potential period of price stabilization.
- The negative OBV and CMF suggest a bearish sentiment prevailing in the market.
Conclusion:
Based on the analysis of the technical indicators, the stock is likely to experience sideways movement in the coming days. The consolidation phase may continue, with limited upside potential in the short term. Investors should exercise caution and closely monitor key support and resistance levels for potential entry or exit points. Overall, the outlook for NUKK stock remains neutral to slightly bearish in the near future.