Technical Analysis of NVCR 2024-05-10
Overview:
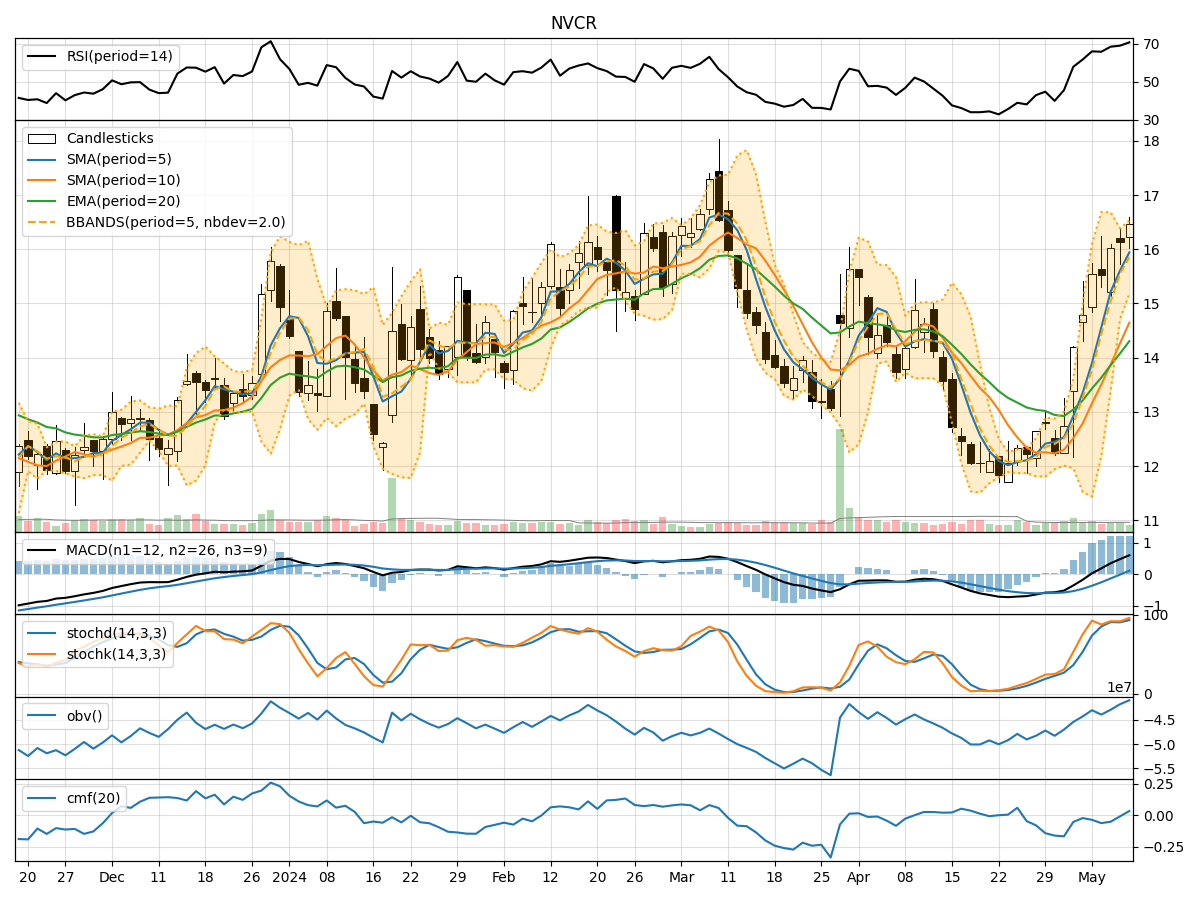
In analyzing the technical indicators for NVCR over the last 5 days, we will delve into the trend, momentum, volatility, and volume indicators to provide a comprehensive outlook on the possible stock price movement in the coming days.
Trend Indicators:
- Moving Averages (MA): The 5-day moving average has been consistently rising, indicating a bullish trend in the short term.
- MACD: The MACD line has been above the signal line for the past few days, suggesting positive momentum.
- RSI: The RSI has been trending upwards, indicating increasing buying pressure.
Momentum Indicators:
- Stochastic Oscillator: Both %K and %D have been in the overbought territory, signaling a potential reversal or consolidation.
- Williams %R: The Williams %R is also in the oversold region, indicating a possible reversal.
Volatility Indicators:
- Bollinger Bands: The stock price has been trading near the upper Bollinger Band, suggesting overbought conditions.
- Volatility: Volatility has been increasing, which could lead to larger price swings.
Volume Indicators:
- On-Balance Volume (OBV): The OBV has been fluctuating, indicating indecision among investors.
- Chaikin Money Flow (CMF): The CMF has been negative, suggesting selling pressure.
Key Observations:
- The trend indicators show a bullish sentiment in the short term.
- Momentum indicators indicate potential overbought conditions and a need for caution.
- Volatility is increasing, which could lead to heightened price fluctuations.
- Volume indicators reflect mixed signals with no clear direction.
Conclusion:
Based on the analysis of the technical indicators, the stock price of NVCR is likely to experience consolidation or a pullback in the coming days. The overbought signals from momentum indicators and the proximity to the upper Bollinger Band suggest a possible downward correction. Investors should exercise caution and consider waiting for a clearer trend to emerge before making significant trading decisions.