Technical Analysis of NVX 2024-05-10
Overview:
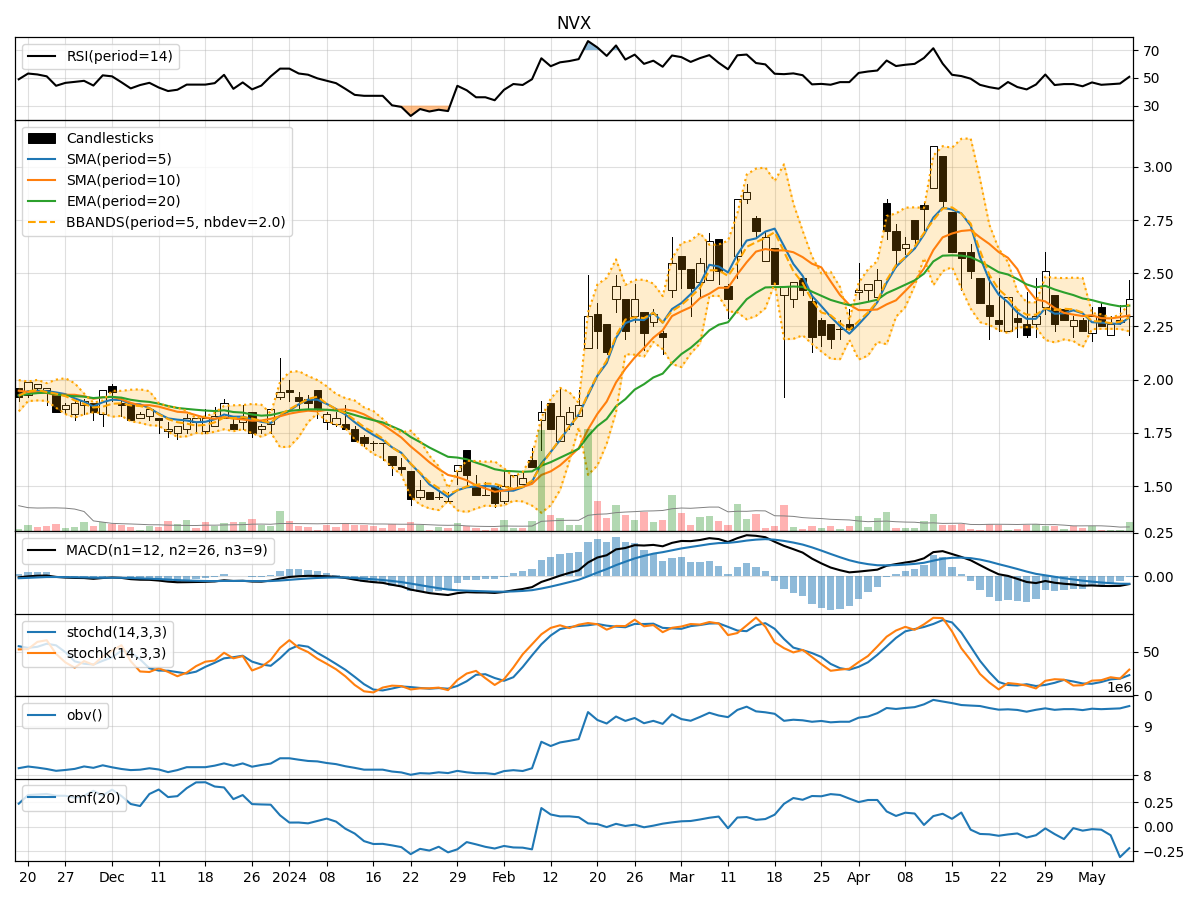
In analyzing the technical indicators for NVX over the last 5 days, we will delve into the trend, momentum, volatility, and volume indicators to provide a comprehensive outlook on the possible stock price movement in the coming days. By examining these key aspects, we aim to offer valuable insights and predictions for potential investors.
Trend Analysis:
- Moving Averages (MA): The 5-day MA has been fluctuating around the closing prices, indicating a lack of clear trend direction.
- MACD: The MACD line has been consistently negative, suggesting a bearish momentum in the short term.
- RSI: The RSI values have been hovering around the mid-range, indicating a neutral sentiment among traders.
Key Observation: The trend indicators suggest a lack of strong directional bias in the stock price movement.
Momentum Analysis:
- Stochastic Oscillator: Both %K and %D values have been relatively low, indicating a potential oversold condition.
- Williams %R: The Williams %R values have been fluctuating in the oversold territory, signaling a possible reversal.
Key Observation: Momentum indicators hint at a potential reversal or consolidation phase in the stock price.
Volatility Analysis:
- Bollinger Bands: The stock price has been trading within the bands, with the %B indicator showing fluctuations but not extreme values.
- Volatility Bands: The volatility bands have widened, suggesting increased price fluctuations.
Key Observation: Volatility indicators point towards heightened price fluctuations but without a clear trend direction.
Volume Analysis:
- On-Balance Volume (OBV): The OBV values have shown a slight increase, indicating some buying pressure.
- Chaikin Money Flow (CMF): The CMF values have been negative, reflecting a net outflow of money from the stock.
Key Observation: Volume indicators show mixed signals with a slight increase in buying pressure but overall negative money flow.
Conclusion:
Based on the analysis of the technical indicators, the stock price of NVX is likely to experience sideways movement in the coming days. The lack of a clear trend direction, coupled with mixed signals from momentum, volatility, and volume indicators, suggests a period of consolidation or indecision among market participants. Investors should exercise caution and closely monitor the price action for any potential breakout or trend reversal.
Recommendation:
Given the current market dynamics and technical signals, it is advisable to wait for a clearer trend to emerge before making any significant trading decisions. Traders may consider setting tight stop-loss orders to manage risk effectively in a sideways market environment. Additionally, keeping a close eye on key support and resistance levels can help in identifying potential breakout opportunities.