Technical Analysis of NWGL 2024-05-10
Overview:
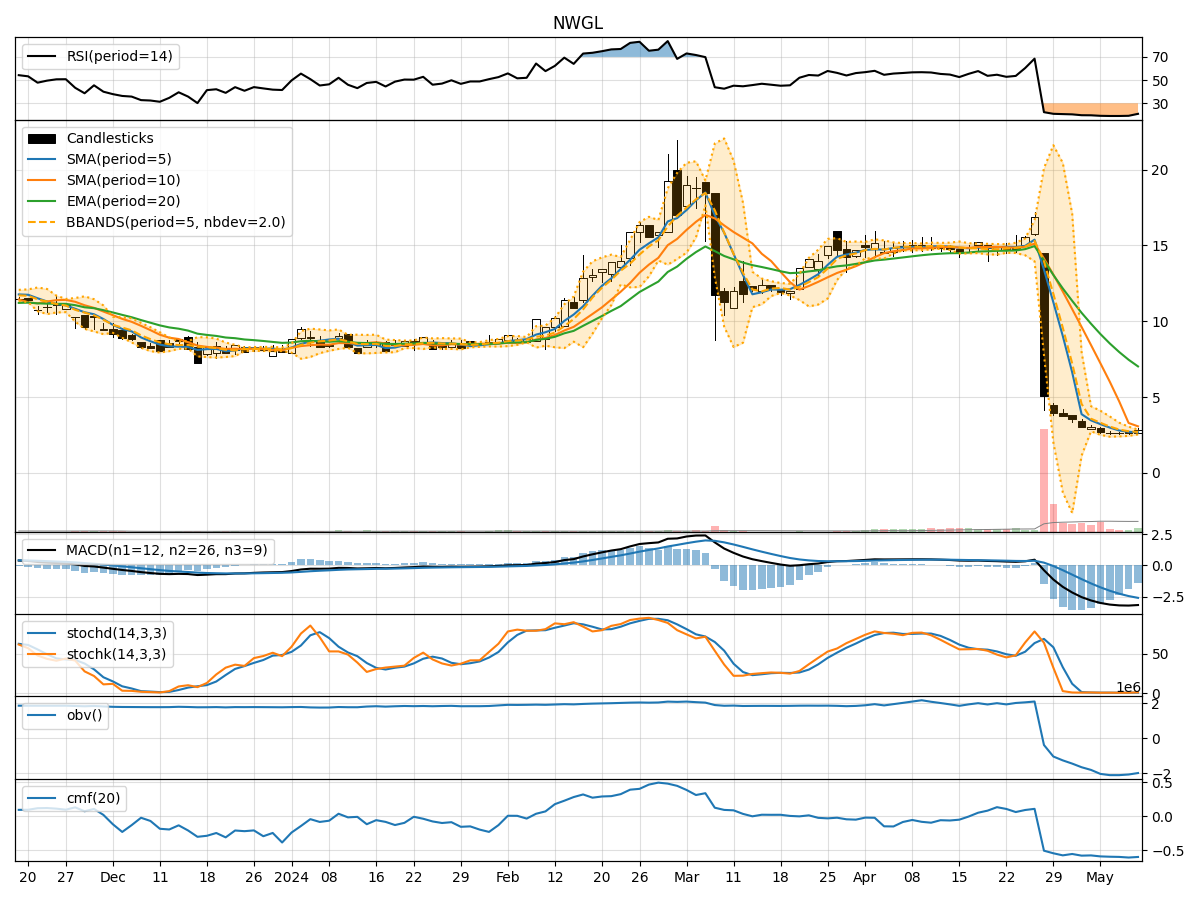
In analyzing the technical indicators for NWGL over the last 5 days, we will delve into the trend, momentum, volatility, and volume indicators to provide a comprehensive outlook on the possible stock price movement in the coming days.
Trend Analysis:
- Moving Averages (MA): The 5-day MA has been consistently below the closing price, indicating a downward trend.
- MACD: The MACD line has been below the signal line, suggesting a bearish trend.
- EMA: The EMA has been declining, further confirming the bearish sentiment.
Momentum Analysis:
- RSI: The RSI has been relatively low, indicating oversold conditions.
- Stochastic Oscillator: Both %K and %D have been in the oversold territory, signaling a potential reversal.
- Williams %R: The indicator has been deeply oversold, suggesting a possible bounce back.
Volatility Analysis:
- Bollinger Bands (BB): The bands have been narrowing, indicating decreasing volatility.
- BB %B: The %B has been increasing, suggesting a potential breakout.
Volume Analysis:
- On-Balance Volume (OBV): The OBV has been declining, indicating selling pressure.
- Chaikin Money Flow (CMF): The CMF has been negative, reflecting outflow of money from the stock.
Key Observations:
- The stock is currently in a downtrend based on moving averages and MACD.
- Momentum indicators suggest the stock is oversold and may see a reversal soon.
- Volatility is decreasing, indicating a possible consolidation phase.
- Volume indicators show selling pressure and a negative money flow.
Conclusion:
Based on the analysis of technical indicators, the next few days may see a potential reversal in the stock price. The oversold conditions and narrowing volatility suggest a possible bounce back in the near term. However, it is crucial to monitor the price action closely for confirmation of a trend reversal. Consider a cautious bullish stance in the short to medium term.