Technical Analysis of NWSA 2024-05-10
Overview:
In analyzing the technical indicators for NWSA over the last 5 days, we will delve into the trend, momentum, volatility, and volume indicators to provide a comprehensive outlook on the possible stock price movement in the coming days.
Trend Analysis:
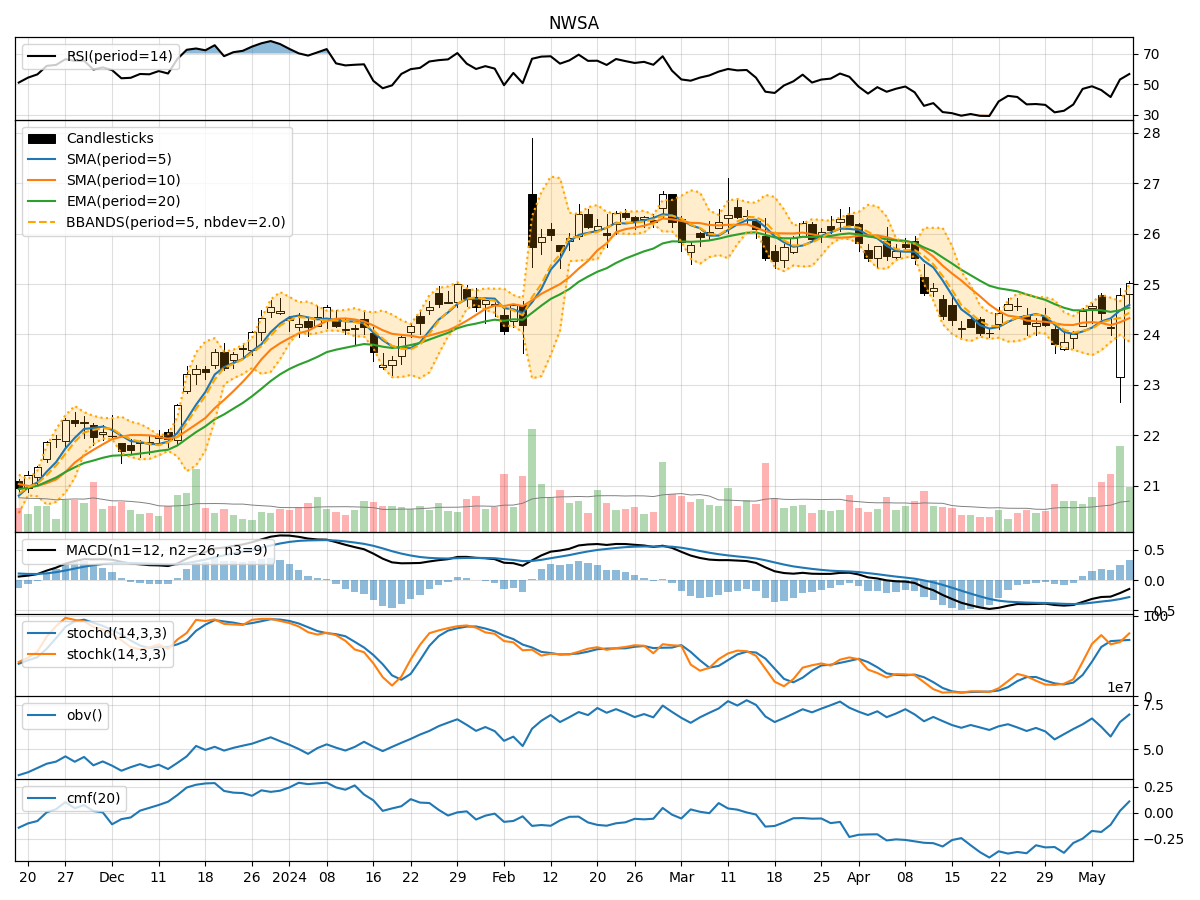
- Moving Averages (MA): The 5-day Moving Average (MA) has been fluctuating around the closing prices, indicating short-term price trends. The Simple Moving Average (SMA) and Exponential Moving Average (EMA) show a slight downward trend, suggesting a potential bearish sentiment.
- MACD: The Moving Average Convergence Divergence (MACD) has been negative but showing signs of convergence towards the signal line, hinting at a possible trend reversal.
- Conclusion: The trend indicators suggest a bearish outlook in the short term.
Momentum Analysis:
- RSI: The Relative Strength Index (RSI) has been oscillating around the neutral 50 level, indicating a lack of strong momentum in either direction.
- Stochastic Oscillator: Both %K and %D have been in the overbought territory, suggesting a potential reversal or consolidation.
- Conclusion: The momentum indicators imply a neutral stance with a potential for a reversal.
Volatility Analysis:
- Bollinger Bands (BB): The Bollinger Bands have been narrowing, indicating decreasing volatility. The bands are currently close to the price, suggesting a potential breakout or significant price movement.
- Conclusion: Volatility indicators point towards a potential breakout in the near future.
Volume Analysis:
- On-Balance Volume (OBV): The OBV has been fluctuating, indicating mixed buying and selling pressure.
- Chaikin Money Flow (CMF): The CMF has been negative, reflecting a lack of strong buying pressure.
- Conclusion: Volume indicators show a mixed sentiment with no clear direction.
Conclusion:
Based on the analysis of the technical indicators, the next few days for NWSA stock price movement could see a potential breakout due to decreasing volatility as indicated by the Bollinger Bands. However, the trend and momentum indicators suggest a bearish bias in the short term, with a possibility of a reversal in momentum. The volume indicators do not provide a clear direction, adding to the uncertainty.
Recommendation:
Considering the overall analysis, it is advisable to exercise caution and closely monitor the price action for potential entry or exit points. Traders may consider setting stop-loss orders to manage risk effectively. Long-term investors should wait for more clarity in the trend and momentum before making significant decisions.
Disclaimer:
This analysis is based solely on technical indicators and historical data, and market dynamics can change rapidly. It is essential to conduct thorough research and consider other factors before making any investment decisions. Consulting with a financial advisor is recommended to align investments with individual risk tolerance and financial goals.