Technical Analysis of NXL 2024-05-31
Overview:
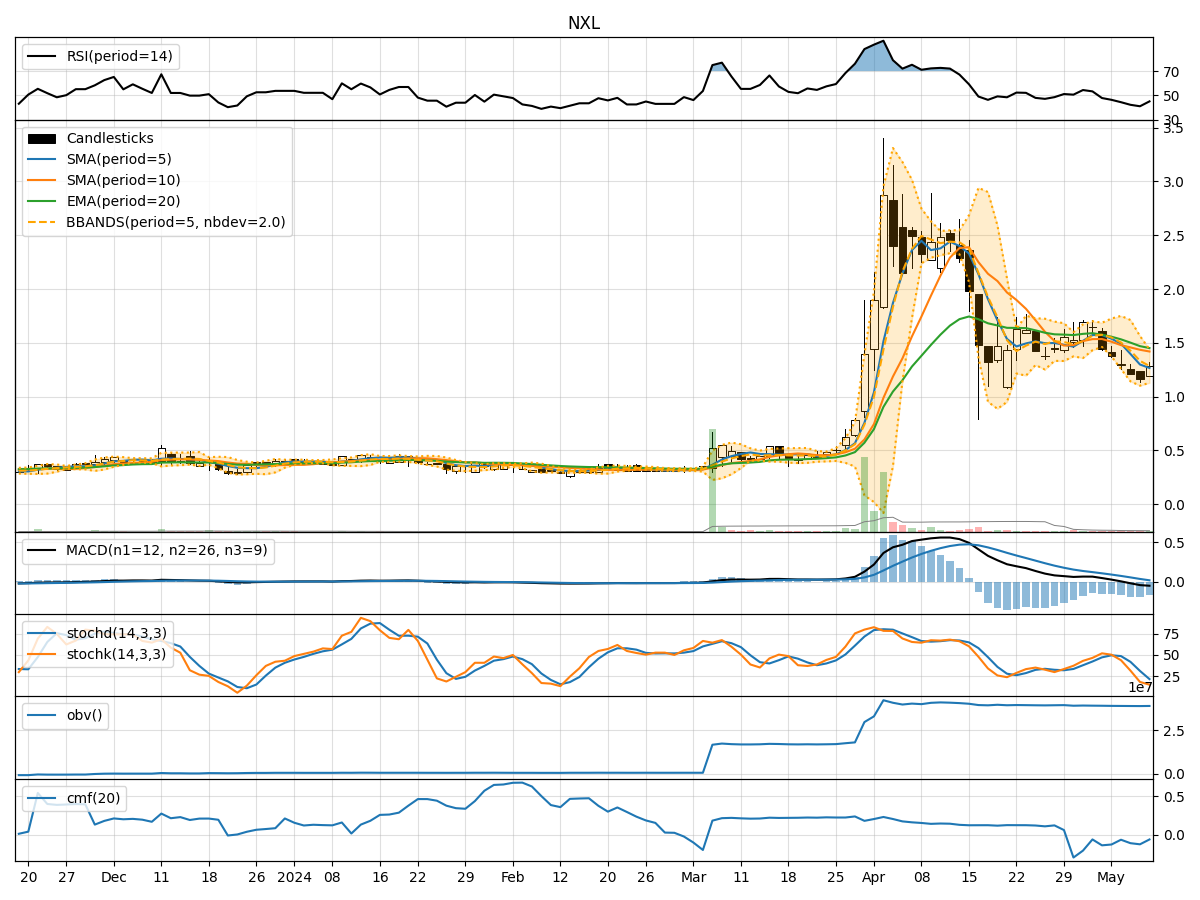
In analyzing the technical indicators for NXL over the last 5 days, we will delve into the trends, momentum, volatility, and volume aspects to provide a comprehensive outlook on the possible stock price movement in the upcoming days. By examining key indicators such as moving averages, MACD, RSI, Bollinger Bands, and OBV, we aim to offer valuable insights and recommendations for potential investors.
Trend Analysis:
- Moving Averages (MA): The 5-day MA has been consistently decreasing, indicating a downward trend in the stock price.
- MACD: The MACD line has been negative, with the MACD histogram also showing a downward trend, suggesting bearish momentum.
Momentum Analysis:
- RSI: The RSI has been below 50, indicating a bearish momentum in the stock.
- Stochastic Oscillator: Both %K and %D have been trending downwards, reflecting a weakening momentum.
Volatility Analysis:
- Bollinger Bands (BB): The stock price has been consistently below the lower Bollinger Band, indicating oversold conditions and potential for a reversal.
Volume Analysis:
- On-Balance Volume (OBV): The OBV has been decreasing, suggesting selling pressure in the stock.
Key Observations:
- The stock is currently in a downtrend based on moving averages and MACD indicators.
- Momentum indicators like RSI and Stochastic Oscillator signal bearish momentum.
- Volatility indicators show the stock is oversold according to Bollinger Bands.
- The decreasing OBV indicates selling pressure in the stock.
Conclusion:
Based on the analysis of the technical indicators, the next few days for NXL are likely to see a continuation of the downward trend with bearish momentum. The stock may experience some volatility as it is currently oversold, but the overall outlook remains bearish. Investors should exercise caution and consider waiting for signs of a potential reversal before considering any long positions.