Technical Analysis of NXTT 2024-05-31
Overview:
In analyzing the technical indicators for NXTT over the last 5 days, we will delve into the trend, momentum, volatility, and volume indicators to provide a comprehensive assessment of the stock's potential price movement. By examining these key factors, we aim to offer valuable insights and predictions for the next few days.
Trend Analysis:
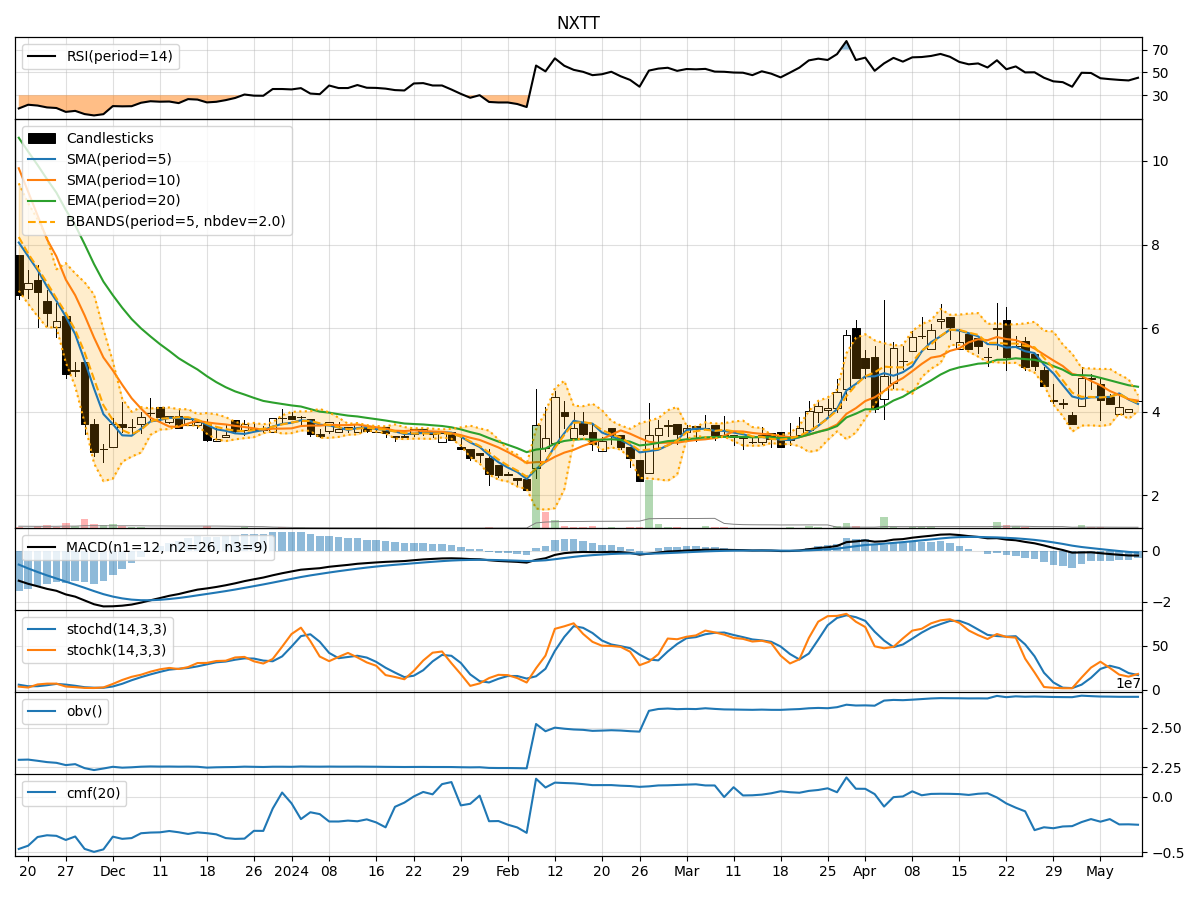
- Moving Averages (MA): The 5-day MA has been consistently below the closing price, indicating a downward trend.
- MACD: The MACD line has been negative, with the MACD histogram also showing a downward trend.
- EMA: The EMA has been declining, further confirming the bearish trend.
Key Observation: The trend indicators suggest a strong bearish sentiment in the stock's price movement.
Momentum Analysis:
- RSI: The RSI has been decreasing but is still above the oversold threshold, indicating a potential for further downside.
- Stochastic Oscillator: Both %K and %D have been decreasing, signaling a loss in momentum.
- Williams %R: The indicator has been in the oversold territory, suggesting a potential reversal.
Key Observation: Momentum indicators point towards a weakening momentum in the stock's price movement.
Volatility Analysis:
- Bollinger Bands (BB): The bands have been narrowing, indicating decreasing volatility.
- BB %B: The %B has been declining, suggesting a consolidation phase.
- BB Width: The width of the bands has been contracting, signaling reduced price fluctuations.
Key Observation: Volatility indicators imply a consolidation phase in the stock's price movement.
Volume Analysis:
- On-Balance Volume (OBV): The OBV has been relatively stable, indicating a balance between buying and selling pressure.
- Chaikin Money Flow (CMF): The CMF has been fluctuating around the zero line, reflecting indecision in the market.
Key Observation: Volume indicators suggest a neutral stance in the stock's price movement.
Conclusion:
Based on the analysis of trend, momentum, volatility, and volume indicators, the overall outlook for NXTT in the next few days is bearish. The trend indicators, momentum signals, and volatility analysis all point towards a potential continuation of the downward trend. While volume indicators show a neutral stance, the overall technical picture indicates a high probability of further downside movement in the stock price.
Key Conclusion: The next few days are likely to see a downward movement in NXTT's stock price. Traders and investors should exercise caution and consider implementing risk management strategies in response to the bearish technical signals.