Technical Analysis of NYXH 2024-05-10
Overview:
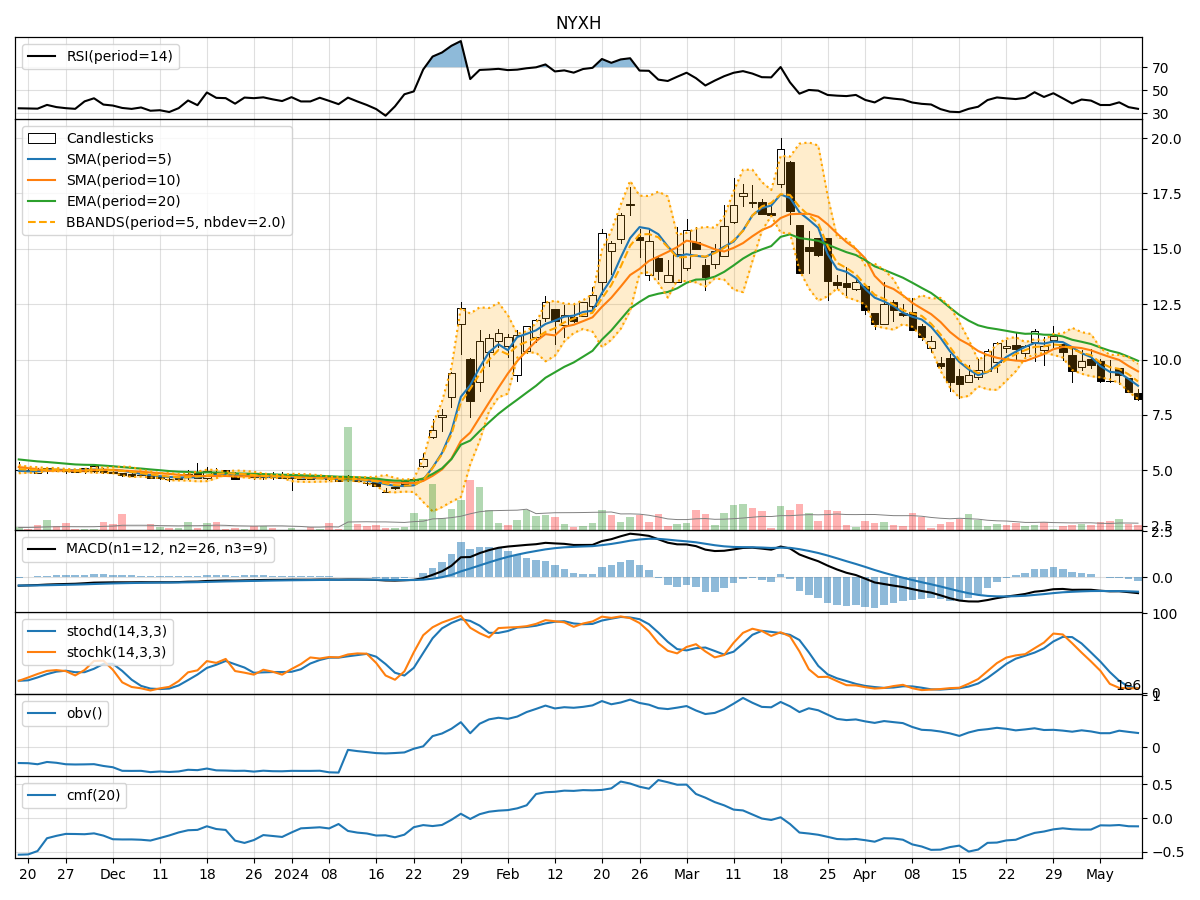
In analyzing the technical indicators for NYXH stock over the last 5 days, we will delve into the trends, momentum, volatility, and volume indicators to provide a comprehensive outlook on the possible future stock price movement. By examining these key indicators, we aim to offer valuable insights and predictions for the upcoming trading days.
Trend Analysis:
- Moving Averages (MA): The 5-day moving average (MA) has been consistently below the closing prices, indicating a downward trend in the short term.
- MACD: The MACD line has been decreasing over the past 5 days, suggesting a bearish momentum in the stock.
- EMA: The exponential moving average has also been trending downwards, further supporting the bearish sentiment in the stock.
Momentum Analysis:
- RSI: The Relative Strength Index (RSI) has been hovering around the oversold territory, indicating a potential reversal or continuation of the downtrend.
- Stochastic Oscillator: Both %K and %D have been at low levels, signaling potential oversold conditions in the stock.
- Williams %R: The Williams %R indicator has consistently been in the oversold region, suggesting a bearish momentum.
Volatility Analysis:
- Bollinger Bands: The Bollinger Bands have been narrowing, indicating decreasing volatility in the stock price.
- Bollinger %B: The %B indicator has been below 0.2 for the past few days, suggesting the stock is oversold.
Volume Analysis:
- On-Balance Volume (OBV): The OBV has been declining, indicating selling pressure in the stock.
- Chaikin Money Flow (CMF): The CMF has been negative, reflecting a lack of buying interest in the stock.
Key Observations:
- The stock is currently in a downtrend based on moving averages and MACD.
- Momentum indicators suggest the stock is oversold and may see a potential reversal.
- Volatility has been decreasing, indicating a lack of significant price movements.
- Volume indicators show selling pressure and a lack of buying interest in the stock.
Conclusion:
Based on the analysis of the technical indicators, the next few days for NYXH stock are likely to see further downside movement in the stock price. The bearish trend, oversold momentum, decreasing volatility, and selling pressure indicated by the volume indicators all point towards a continuation of the current downtrend. Traders and investors should exercise caution and consider short-term selling or wait for a clear reversal signal before considering long positions.