Technical Analysis of OAKU 2024-05-10
Overview:
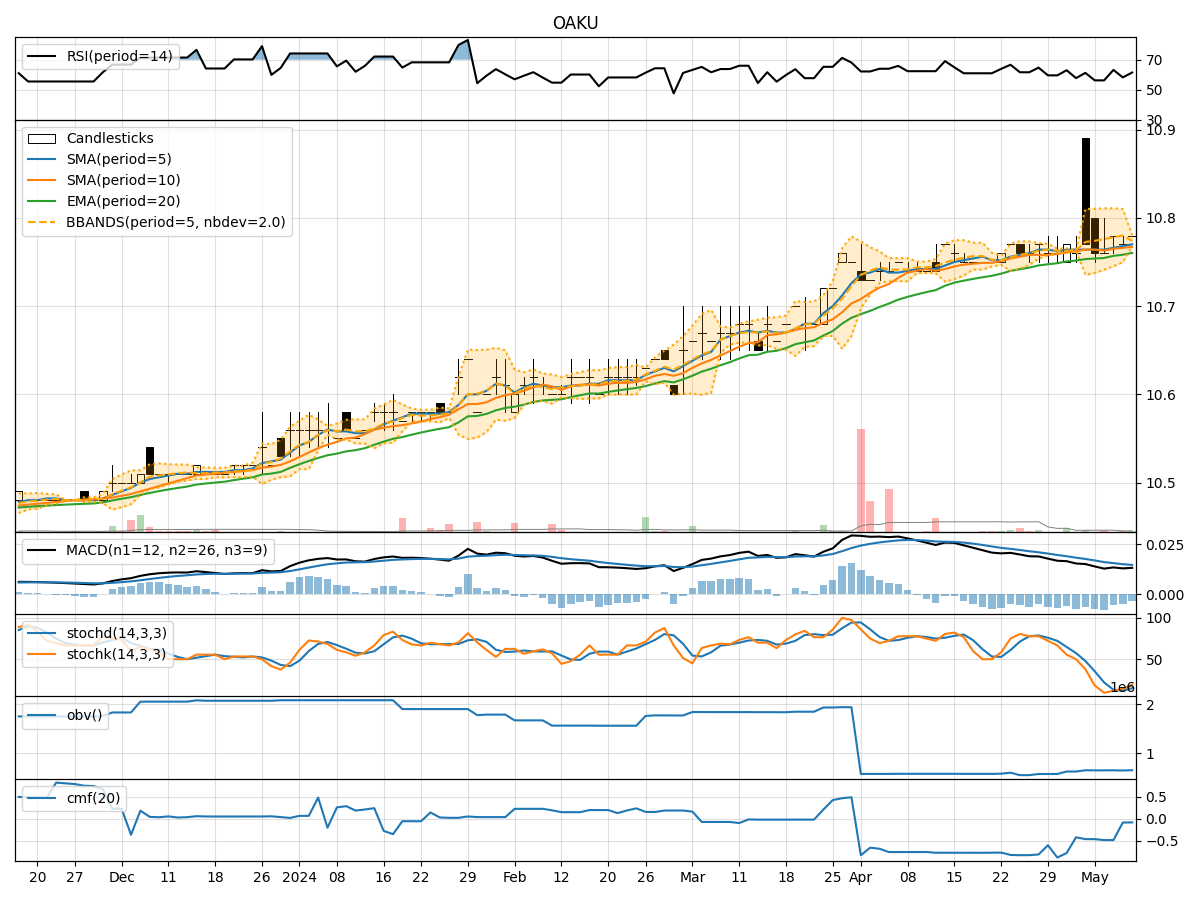
In analyzing the technical indicators for OAKU stock over the last 5 days, we will delve into the trend, momentum, volatility, and volume indicators to provide a comprehensive outlook on the possible future stock price movement. By examining these key indicators, we aim to offer valuable insights and recommendations for potential investors.
Trend Analysis:
- Moving Averages (MA): The 5-day Moving Average (MA) has been steadily increasing, indicating a positive trend in the stock price.
- MACD: The MACD line has been consistently above the signal line, suggesting bullish momentum in the stock.
- EMA: The Exponential Moving Average (EMA) has also been on an upward trajectory, supporting the bullish sentiment in the short to medium term.
Momentum Analysis:
- RSI: The Relative Strength Index (RSI) has been fluctuating around the neutral zone, indicating a balanced momentum in the stock.
- Stochastic Oscillator: Both %K and %D have shown slight increases, but they are still in the oversold territory, suggesting a potential reversal in the near future.
- Williams %R: The Williams %R is in the oversold region, indicating a possible buying opportunity.
Volatility Analysis:
- Bollinger Bands: The Bollinger Bands have been widening, indicating increased volatility in the stock price.
- Bollinger %B: The %B indicator is hovering around the upper band, suggesting that the stock may be overbought in the short term.
Volume Analysis:
- On-Balance Volume (OBV): The OBV has been fluctuating, indicating indecision among investors regarding the stock.
- Chaikin Money Flow (CMF): The CMF has been negative, reflecting selling pressure in the stock.
Key Observations:
- The trend indicators suggest a bullish sentiment in the stock, supported by the moving averages and MACD.
- Momentum indicators show a mixed outlook, with RSI indicating neutrality and stochastic oscillators hinting at a potential reversal.
- Volatility has increased, as seen in the widening Bollinger Bands, which may lead to sharp price movements.
- Volume indicators reflect uncertainty among investors, with OBV fluctuating and CMF showing selling pressure.
Conclusion:
Based on the analysis of the technical indicators, the stock is likely to experience a short-term upward movement due to the bullish trend indicated by moving averages and MACD. However, caution is advised as momentum indicators suggest a potential reversal, and increased volatility could lead to sharp price fluctuations. Investors should closely monitor the stock's performance and consider setting stop-loss orders to manage risk effectively.