Technical Analysis of OLK 2024-05-10
Overview:
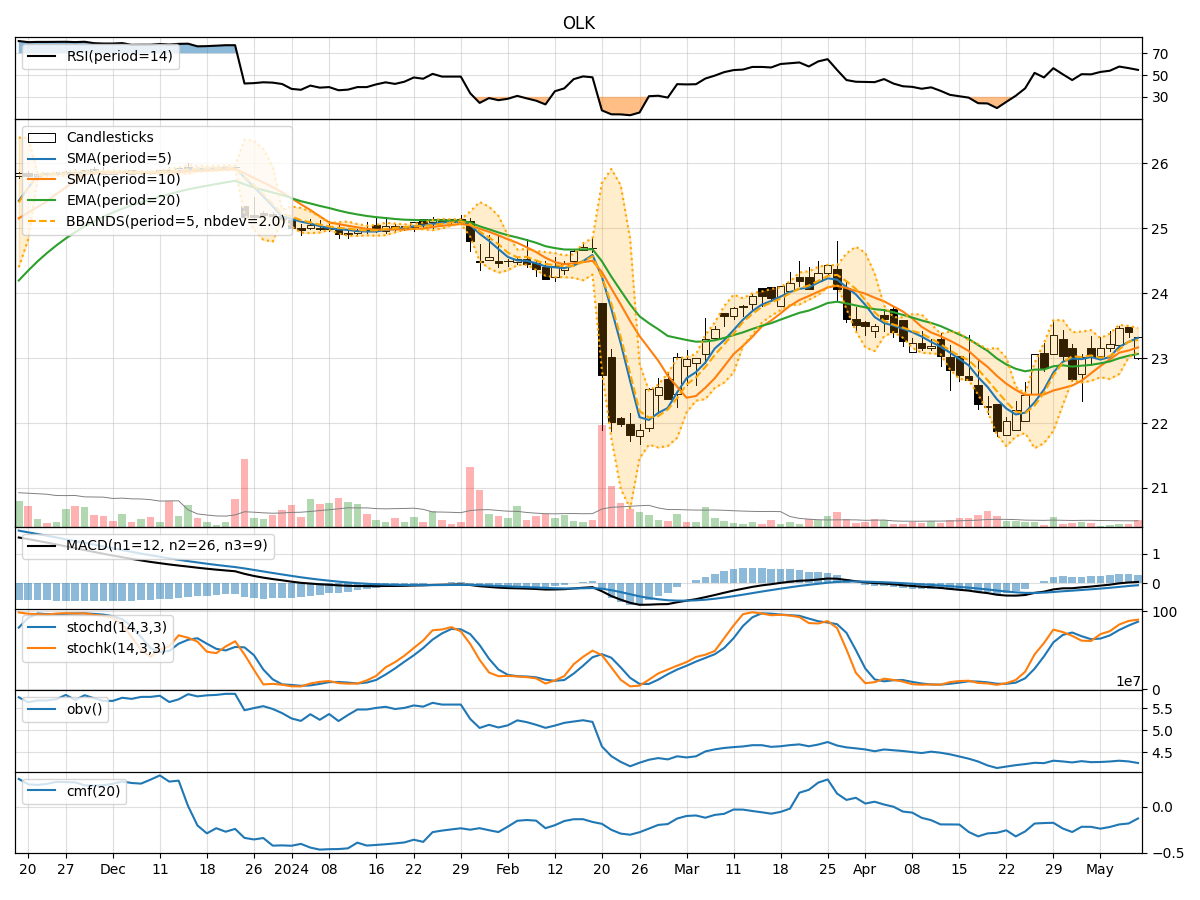
In analyzing the technical indicators for OLK stock over the last 5 days, we will delve into the trends, momentum, volatility, and volume aspects to provide a comprehensive outlook on the possible future stock price movement. By examining key indicators such as moving averages, MACD, RSI, Bollinger Bands, and OBV, we aim to offer valuable insights and predictions for the upcoming trading days.
Trend Analysis:
- Moving Averages (MA): The 5-day MA has been consistently trending upwards, indicating a positive momentum in the stock price.
- MACD: The MACD line has been above the signal line for the past few days, suggesting a bullish trend.
- EMA: The EMA(20) has been steadily increasing, supporting the bullish sentiment in the short to medium term.
Momentum Analysis:
- RSI: The RSI has been fluctuating around the neutral zone, indicating a balanced momentum without extreme overbought or oversold conditions.
- Stochastic Oscillator: Both %K and %D have been in the overbought territory, suggesting a potential reversal or consolidation phase.
- Williams %R: The Williams %R is in the oversold region, signaling a possible buying opportunity.
Volatility Analysis:
- Bollinger Bands: The stock price has been trading within the Bollinger Bands, indicating a period of consolidation and range-bound movement.
- Bollinger %B: The %B indicator is below 1, suggesting that the stock price is trading below the lower Bollinger Band, potentially indicating an oversold condition.
Volume Analysis:
- On-Balance Volume (OBV): The OBV has been declining over the past few days, indicating selling pressure and potential bearish sentiment.
- Chaikin Money Flow (CMF): The CMF(20) is negative, suggesting that money is flowing out of the stock, supporting the bearish outlook.
Conclusion:
Based on the analysis of the technical indicators, the next few days for OLK stock are likely to see sideways consolidation with a slight bearish bias. The stock may trade within a range as indicated by the Bollinger Bands, with a potential for a minor pullback in price due to the overbought signals from the Stochastic Oscillator. Traders should exercise caution and consider waiting for clearer signals before making significant trading decisions.