Technical Analysis of OLLI 2024-05-10
Overview:
In analyzing the technical indicators for OLLI over the last 5 days, we will delve into the trend, momentum, volatility, and volume indicators to provide a comprehensive outlook on the possible stock price movement in the coming days. By examining these key indicators, we aim to offer valuable insights and predictions for informed decision-making.
Trend Analysis:
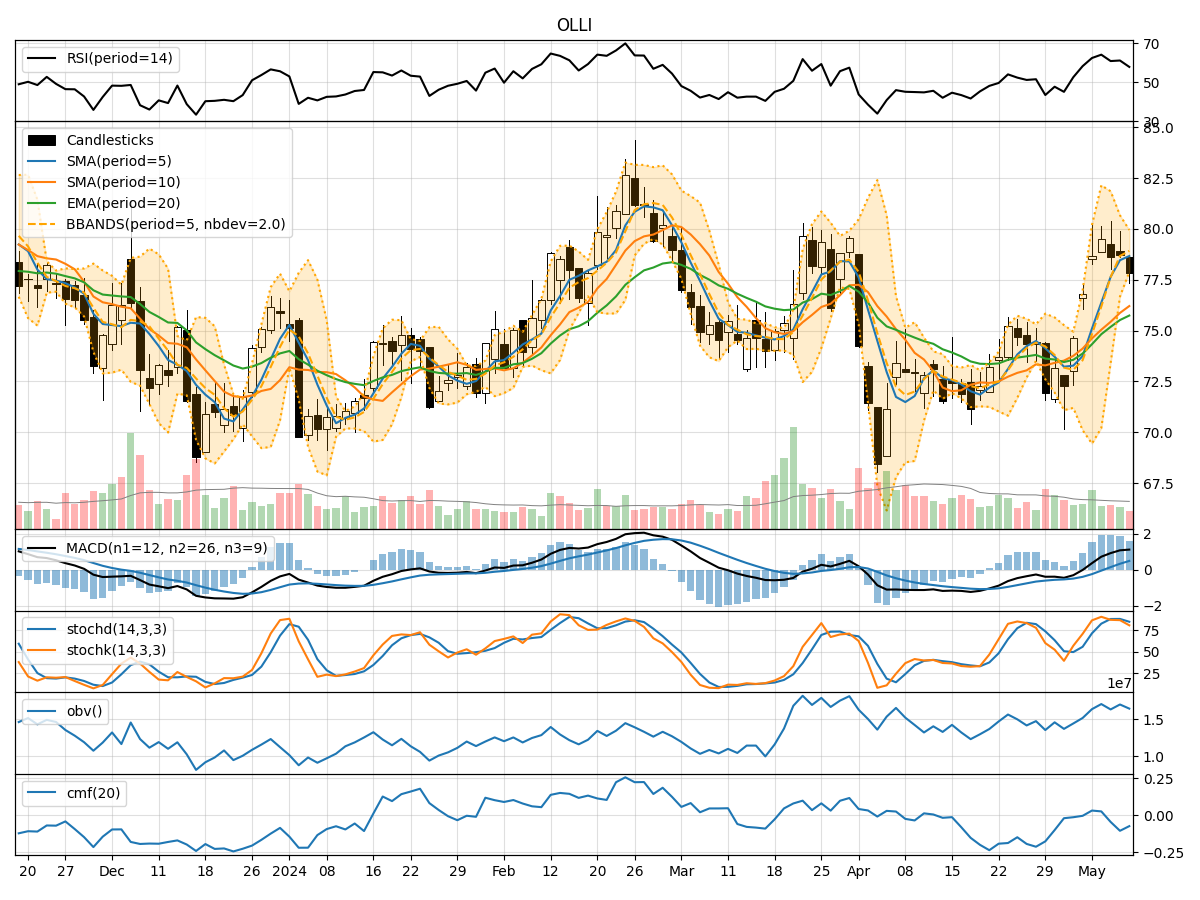
- Moving Averages (MA): The 5-day MA has been consistently above the closing prices, indicating a bullish trend.
- MACD: The MACD line has been above the signal line, suggesting a bullish momentum.
- Relative Strength Index (RSI): The RSI has been fluctuating around the 60-70 range, indicating a neutral to slightly bullish sentiment.
Momentum Analysis:
- Stochastic Oscillator: The Stochastic Oscillator has been in the overbought territory, signaling a potential reversal or consolidation.
- Williams %R (Willr): The Williams %R has been in the oversold region, suggesting a possible buying opportunity.
Volatility Analysis:
- Bollinger Bands (BB): The stock price has been trading within the bands, indicating moderate volatility.
- Bollinger Band %B (bbp): The %B has been fluctuating around 0.5, suggesting a balanced market sentiment.
Volume Analysis:
- On-Balance Volume (OBV): The OBV has shown mixed signals, reflecting indecision among market participants.
- Chaikin Money Flow (CMF): The CMF has been negative, indicating selling pressure in the market.
Key Observations:
- The trend indicators suggest a bullish bias in the short term.
- Momentum indicators point towards a potential reversal or consolidation phase.
- Volatility remains moderate, with no extreme price movements expected.
- Volume indicators reflect a lack of strong buying interest.
Conclusion:
Based on the analysis of the technical indicators, the next few days' possible stock price movement for OLLI is likely to experience a consolidation phase. The bullish trend may pause or undergo a minor correction before potentially resuming its upward trajectory. Traders should exercise caution and monitor key support and resistance levels for potential entry or exit points. Overall, the outlook remains neutral with a slight bullish bias in the short term.