Technical Analysis of OLPX 2024-05-10
Overview:
In analyzing the technical indicators for OLPX stock over the last 5 days, we will delve into the trends, momentum, volatility, and volume aspects to provide a comprehensive outlook on the possible stock price movement in the coming days. By examining key indicators such as moving averages, MACD, RSI, Bollinger Bands, and OBV, we aim to offer valuable insights and predictions for potential price action.
Trend Analysis:
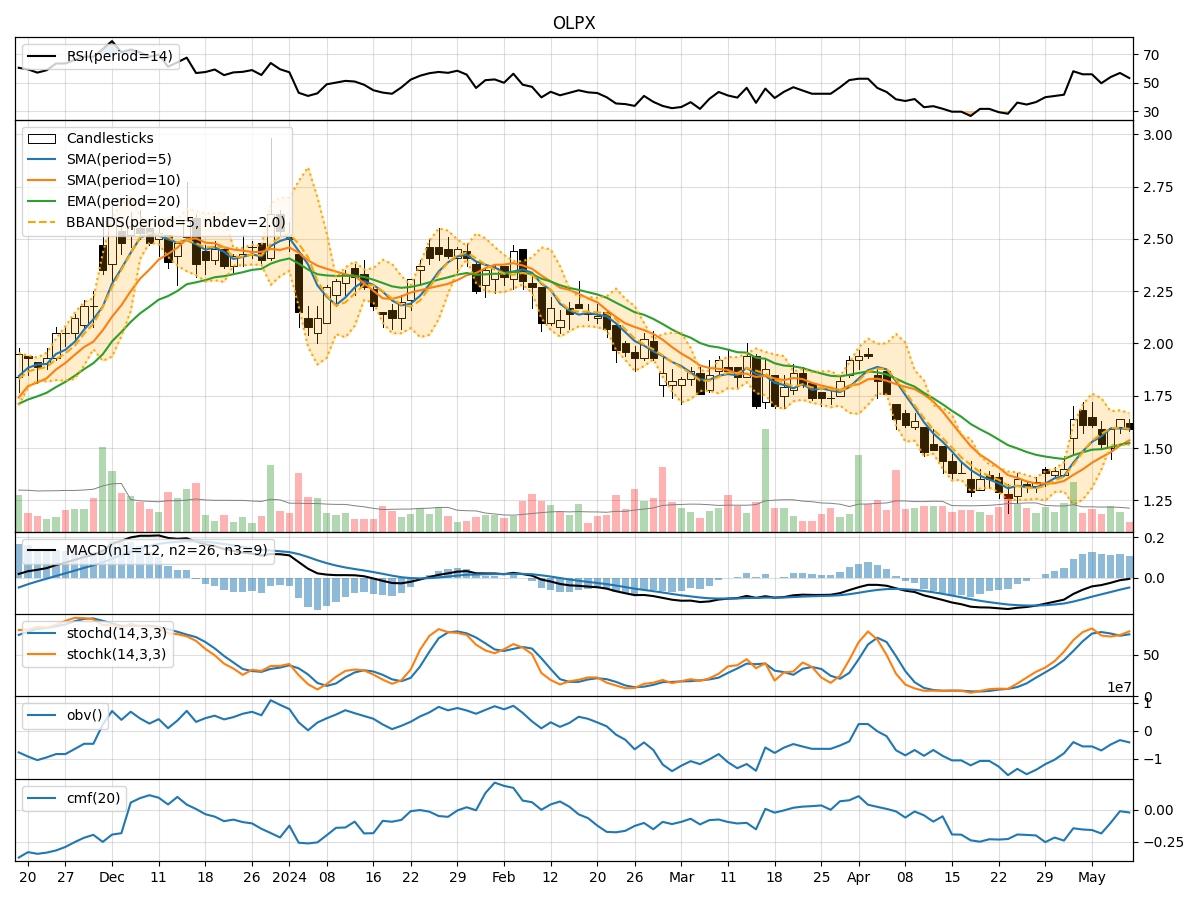
- Moving Averages (MA): The 5-day moving average has been fluctuating around the closing prices, indicating short-term price trends. The SMA(10) and EMA(20) show a gradual increase over the period, suggesting a positive trend.
- MACD: The MACD line has been consistently below the signal line, indicating a bearish momentum. However, the MACD histogram has shown signs of convergence, hinting at a potential trend reversal.
Momentum Analysis:
- RSI: The RSI values have been fluctuating around the mid-range, indicating indecision in the market. There is no clear overbought or oversold signal.
- Stochastic Oscillator: The stochastic indicators have shown mixed signals, with no extreme readings in either direction. This suggests a lack of strong momentum.
Volatility Analysis:
- Bollinger Bands: The Bollinger Bands have narrowed over the period, indicating decreasing volatility. The price has been trading within the bands, suggesting a period of consolidation.
- BB% (Bollinger Band Percentage): The BB% has remained relatively stable, indicating a lack of significant price movements outside the bands.
Volume Analysis:
- On-Balance Volume (OBV): The OBV values have shown a slight decline, indicating a decrease in buying pressure. This could potentially lead to a weakening of the bullish trend.
- Chaikin Money Flow (CMF): The CMF values have been negative, suggesting a lack of buying interest in the market.
Conclusion:
Based on the analysis of the technical indicators, the stock of OLPX is currently exhibiting signs of consolidation with limited volatility and lackluster momentum. The moving averages indicate a slight bullish bias, but the MACD and RSI do not provide a clear direction. The Bollinger Bands suggest a sideways movement in the near term.
Considering the overall picture, it is likely that OLPX stock will continue to trade in a sideways range with limited upside potential in the coming days. Traders should exercise caution and wait for clearer signals before making significant trading decisions.