Technical Analysis of OMH 2024-05-10
Overview:
In analyzing the technical indicators for OMH stock over the last 5 days, we will delve into the trend, momentum, volatility, and volume indicators to provide a comprehensive outlook on the possible stock price movement in the coming days. By examining these key indicators, we aim to offer valuable insights and recommendations for potential investors.
Trend Analysis:
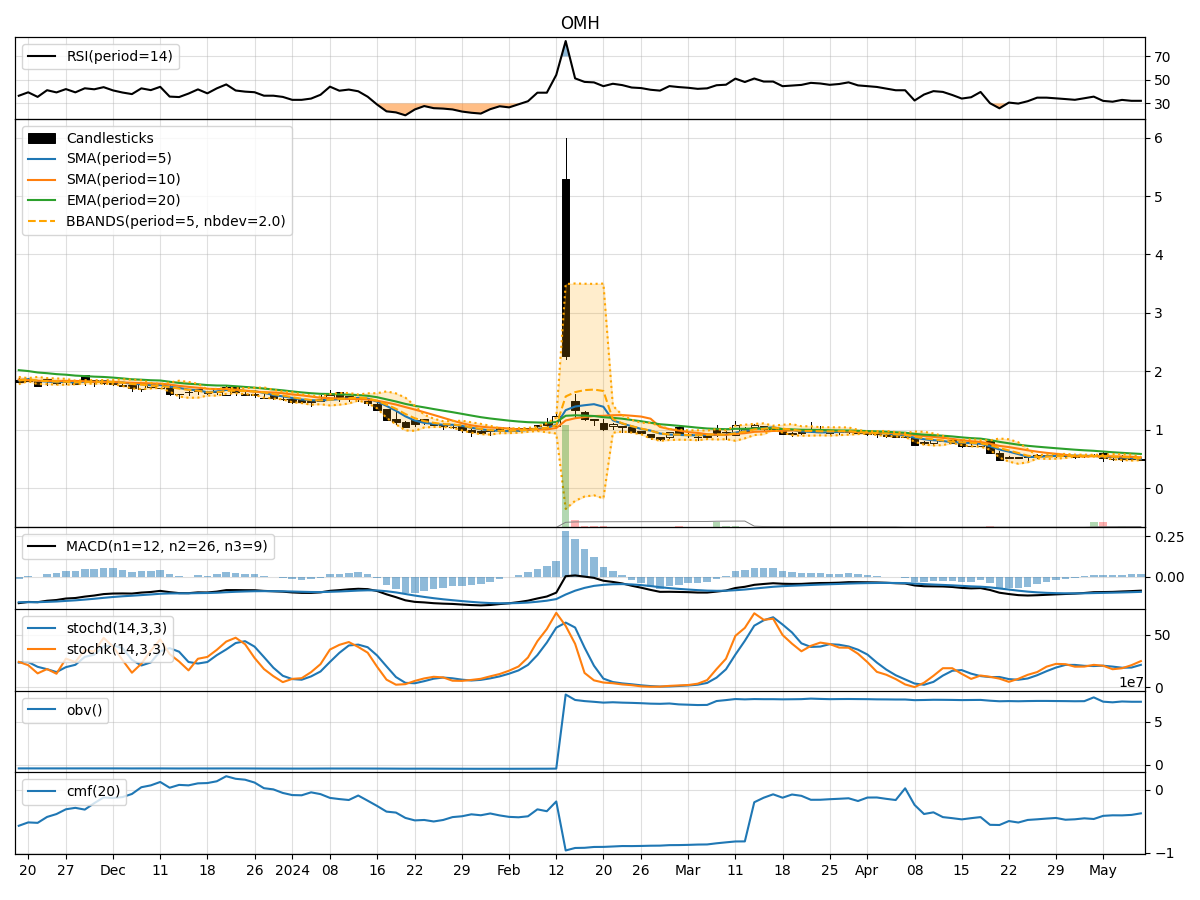
- Moving Averages (MA): The 5-day MA has been consistently below the closing prices, indicating a downward trend.
- MACD: The MACD line has been negative, suggesting bearish momentum in the stock.
- EMA: The EMA values have been declining, further supporting the bearish trend.
Key Observation: The trend indicators point towards a downward trajectory for OMH stock.
Momentum Analysis:
- RSI: The RSI values have been relatively low, indicating oversold conditions.
- Stochastic Oscillator: Both %K and %D values have been low, reflecting weak momentum.
- Williams %R: The values have been in the oversold territory, signaling a potential reversal.
Key Observation: The momentum indicators suggest a potential reversal or a temporary bounce in the stock price.
Volatility Analysis:
- Bollinger Bands: The stock price has been trading below the lower Bollinger Band, indicating oversold conditions.
- Bollinger %B: The %B values have been low, suggesting a possible bounce back.
Key Observation: The volatility indicators imply a potential reversal or short-term bounce in the stock price.
Volume Analysis:
- On-Balance Volume (OBV): The OBV values have been relatively stable, indicating no significant divergence.
- Chaikin Money Flow (CMF): The CMF values have been negative, reflecting selling pressure.
Key Observation: The volume indicators do not provide a clear signal but suggest neutral sentiment.
Conclusion:
Based on the analysis of trend, momentum, volatility, and volume indicators, the overall outlook for OMH stock in the next few days is bearish. However, considering the oversold conditions indicated by momentum and volatility indicators, there might be a potential reversal or short-term bounce in the stock price before resuming the downtrend.
Recommendation: Investors should exercise caution and consider waiting for confirmation of a reversal pattern before considering any long positions. Short-term traders may look for opportunities to capitalize on the potential bounce, but long-term investors should wait for a more stable trend to emerge before entering or adding to positions.
Key Conclusion: The stock is likely to experience a short-term bounce within the overall bearish trend.