Technical Analysis of OPAL 2024-05-10
Overview:
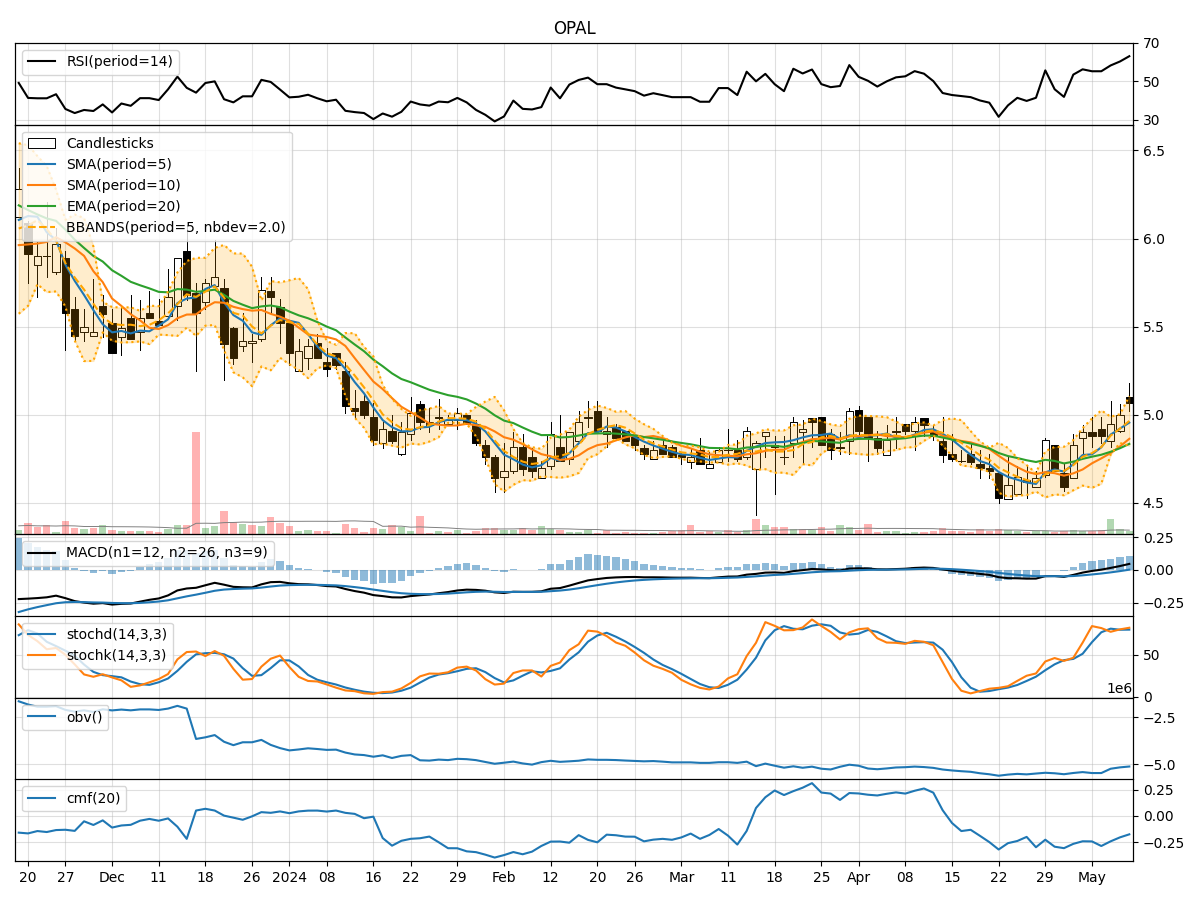
In analyzing the technical indicators for OPAL stock over the last 5 days, we will delve into the trend, momentum, volatility, and volume indicators to provide a comprehensive outlook on the possible future stock price movement. By examining these key indicators, we aim to offer valuable insights and predictions for the upcoming trading days.
Trend Analysis:
- Moving Averages (MA): The 5-day Moving Average (MA) has been consistently rising, indicating a bullish trend in the short term.
- MACD: The MACD line has been above the signal line for the past 5 days, suggesting a bullish momentum in the stock.
- EMA: The Exponential Moving Average has also been trending upwards, supporting the bullish sentiment in the stock.
Key Observation: The trend indicators point towards a bullish outlook for OPAL stock in the near future.
Momentum Analysis:
- RSI: The Relative Strength Index has been increasing, showing strengthening buying momentum.
- Stochastic Oscillator: Both %K and %D have been in the overbought zone, indicating a strong bullish momentum.
- Williams %R: The Williams %R is in the oversold territory, suggesting a potential reversal in the stock price.
Key Observation: Momentum indicators signal a strong bullish sentiment for OPAL stock.
Volatility Analysis:
- Bollinger Bands: The stock price has been trading within the upper Bollinger Band, indicating high volatility.
- Bollinger %B: The %B value is above 0.8, suggesting that the stock is trading at the upper range of volatility.
- Average True Range (ATR): ATR value has increased, indicating higher volatility in the stock.
Key Observation: Volatility indicators suggest increased volatility in OPAL stock.
Volume Analysis:
- On-Balance Volume (OBV): The OBV has been negative, indicating distribution and selling pressure in the stock.
- Chaikin Money Flow (CMF): The CMF value is negative, suggesting outflow of money from the stock.
Key Observation: Volume indicators reflect bearish sentiment in OPAL stock.
Conclusion:
Based on the analysis of trend, momentum, volatility, and volume indicators, the overall outlook for OPAL stock is as follows:
- Trend: Upward
- Momentum: Strongly Bullish
- Volatility: Increased
- Volume: Bearish
Future Price Movement Prediction:
Considering the bullish trend and momentum, coupled with increased volatility, we anticipate that OPAL stock is likely to experience further upward movement in the next few trading days. However, the bearish volume indicators suggest caution, and investors should closely monitor the stock for any signs of reversal in the selling pressure.
Recommendation:
Based on the technical analysis, it is recommended to consider buying OPAL stock for potential short to medium-term gains. Traders should set appropriate stop-loss levels to manage risks effectively. Additionally, staying updated on market news and events that may impact the stock's price movement is crucial for making informed trading decisions.