Technical Analysis of OSW 2024-05-10
Overview:
In analyzing the technical indicators for OSW stock over the last 5 days, we will delve into the trend, momentum, volatility, and volume indicators to provide a comprehensive outlook on the possible future stock price movement. By examining these key aspects, we aim to offer valuable insights and recommendations for potential investors.
Trend Indicators:
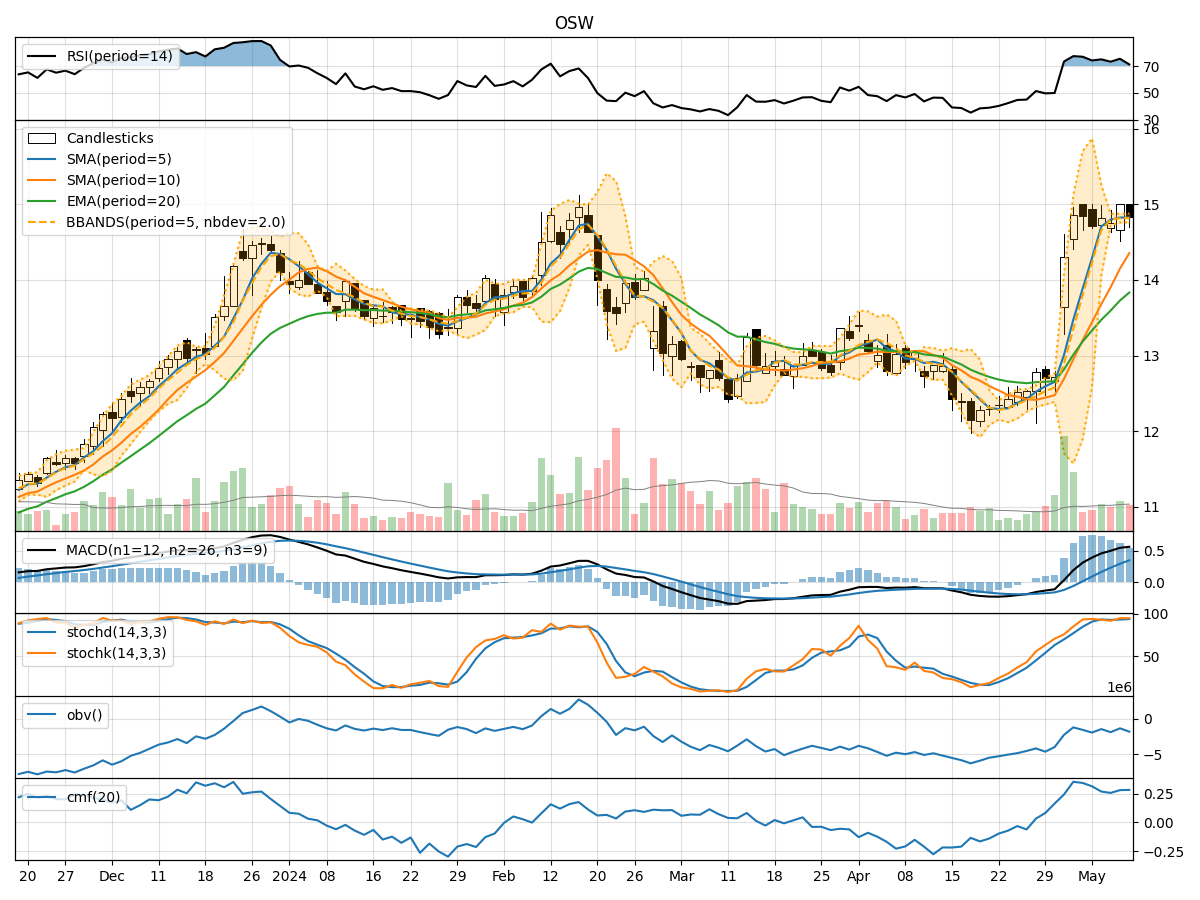
- Moving Averages (MA): The 5-day MA has been consistently above the closing prices, indicating a bullish trend.
- MACD: The MACD line has been above the signal line, suggesting a bullish momentum.
- RSI: The RSI values have been relatively high, indicating overbought conditions.
Key Observation: The trend indicators point towards a bullish sentiment in the stock price movement.
Momentum Indicators:
- Stochastic Oscillator: Both %K and %D values have been high, indicating strong buying momentum.
- Williams %R: The values have been in the oversold territory, suggesting a potential reversal.
Key Observation: Momentum indicators reflect a strong buying momentum with a possibility of a reversal in the short term.
Volatility Indicators:
- Bollinger Bands (BB): The stock price has been trading within the bands, indicating moderate volatility.
- BB% (Bollinger Band %B): The %B values have been fluctuating around the midline, suggesting a balanced volatility.
Key Observation: Volatility indicators show a stable price movement within the bands, indicating a balanced market sentiment.
Volume Indicators:
- On-Balance Volume (OBV): The OBV values have been fluctuating, indicating mixed buying and selling pressure.
- Chaikin Money Flow (CMF): The CMF values have been positive, suggesting a net inflow of money into the stock.
Key Observation: Volume indicators depict a mixed sentiment with a slight positive bias towards buying pressure.
Conclusion:
Based on the analysis of trend, momentum, volatility, and volume indicators, the next few days' possible stock price movement for OSW is likely to continue in an upward direction. The bullish trend indicated by moving averages and MACD, coupled with strong buying momentum from stochastic oscillator, supports the upward trajectory. However, caution should be exercised as the RSI indicates overbought conditions, and a potential reversal might occur in the short term. The stable volatility within the Bollinger Bands and mixed volume indicators suggest a balanced market sentiment. Overall, a cautiously bullish view is recommended for the next few days.