Technical Analysis of OZK 2024-05-10
Overview:
In analyzing the technical indicators for OZK stock over the last 5 days, we will delve into the trend, momentum, volatility, and volume indicators to provide a comprehensive outlook on the possible future stock price movement. By examining these key indicators, we aim to offer valuable insights and recommendations for potential investors.
Trend Analysis:
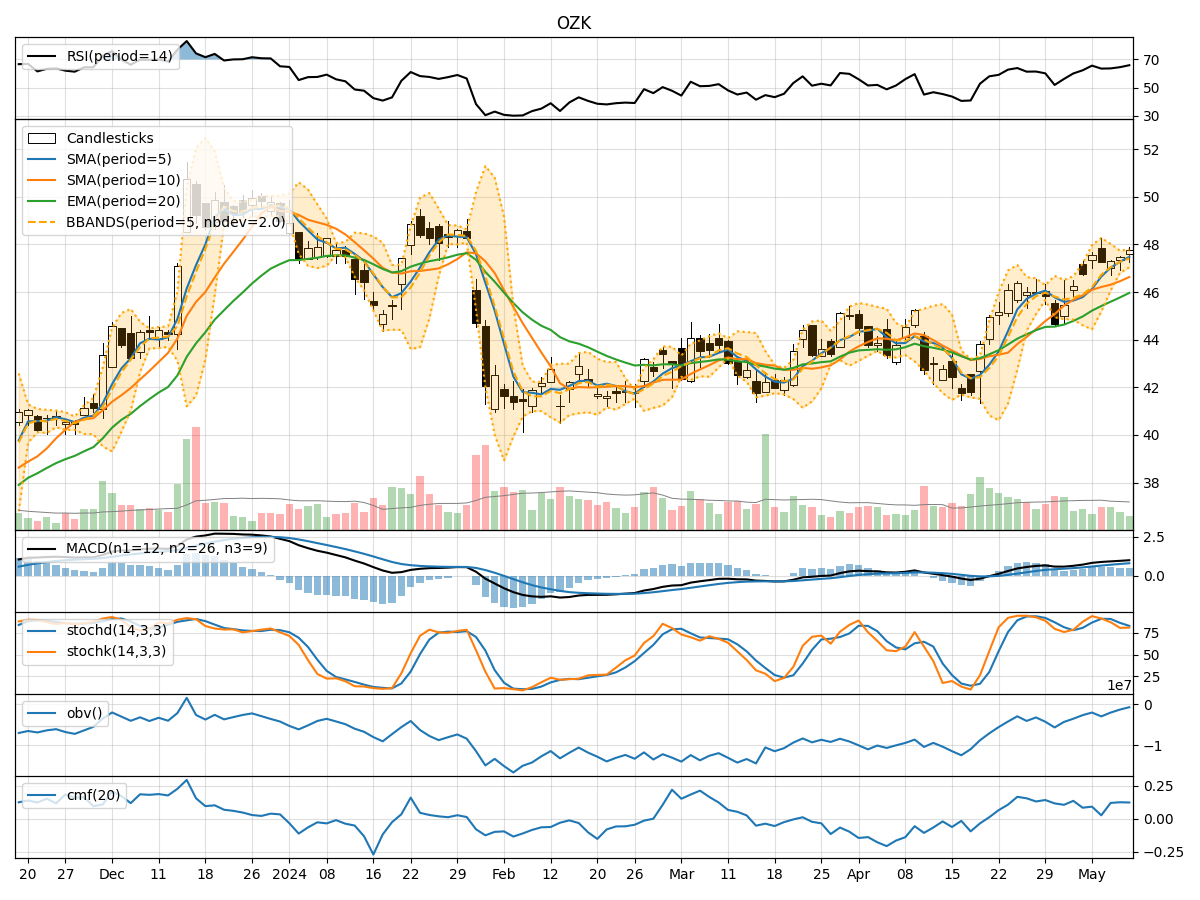
- Moving Averages (MA): The 5-day MA has been consistently above the 10-day SMA, indicating a short-term bullish trend.
- Exponential Moving Average (EMA): The EMA has been steadily increasing, reflecting a positive momentum in the stock price.
- Moving Average Convergence Divergence (MACD): The MACD and signal line have been trending upwards, suggesting a strengthening bullish momentum.
Momentum Analysis:
- Relative Strength Index (RSI): The RSI has been in the overbought territory, indicating a potential reversal or consolidation phase.
- Stochastic Oscillator (Stoch): Both %K and %D have shown a decline from overbought levels, signaling a possible shift towards a bearish momentum.
- Williams %R (WillR): The Williams %R has moved from oversold to neutral levels, suggesting a potential reversal in the stock price.
Volatility Analysis:
- Bollinger Bands (BB): The stock price has been trading within the upper Bollinger Band, indicating an overbought condition.
- Bollinger Band Width (BBW): The BBW has been narrowing, suggesting a decrease in volatility and a possible period of consolidation.
- Bollinger Band %B (BBP): The %B indicator is above 0.8, indicating an overbought condition.
Volume Analysis:
- On-Balance Volume (OBV): The OBV has shown a consistent increase, reflecting strong buying pressure in the stock.
- Chaikin Money Flow (CMF): The CMF has been positive, indicating a bullish money flow into the stock.
Conclusion:
Based on the analysis of the technical indicators, the next few days' possible stock price movement for OZK is likely to experience a short-term consolidation or pullback. The overbought conditions in the RSI and Williams %R, coupled with the narrowing Bollinger Bands and potential bearish divergence in the Stochastic Oscillator, suggest a temporary pause in the bullish momentum. Investors should be cautious of a possible correction or sideways movement in the stock price in the near term.
Key Recommendations:
- Consider taking profits: Investors holding long positions may consider taking partial profits to lock in gains.
- Monitor key support levels: Watch for any breakdown below key support levels as a signal for a potential trend reversal.
- Wait for confirmation: Wait for confirmation from multiple indicators before making any significant trading decisions.
By staying vigilant and monitoring the evolving market dynamics, investors can navigate potential price fluctuations and make informed decisions aligned with their investment goals and risk tolerance.