Technical Analysis of PACB 2024-05-31
Overview:
In analyzing the technical indicators for PACB over the last 5 days, we will delve into the trend, momentum, volatility, and volume indicators to provide a comprehensive outlook on the possible stock price movement in the coming days. By examining these key indicators, we aim to offer valuable insights and predictions for informed decision-making.
Trend Analysis:
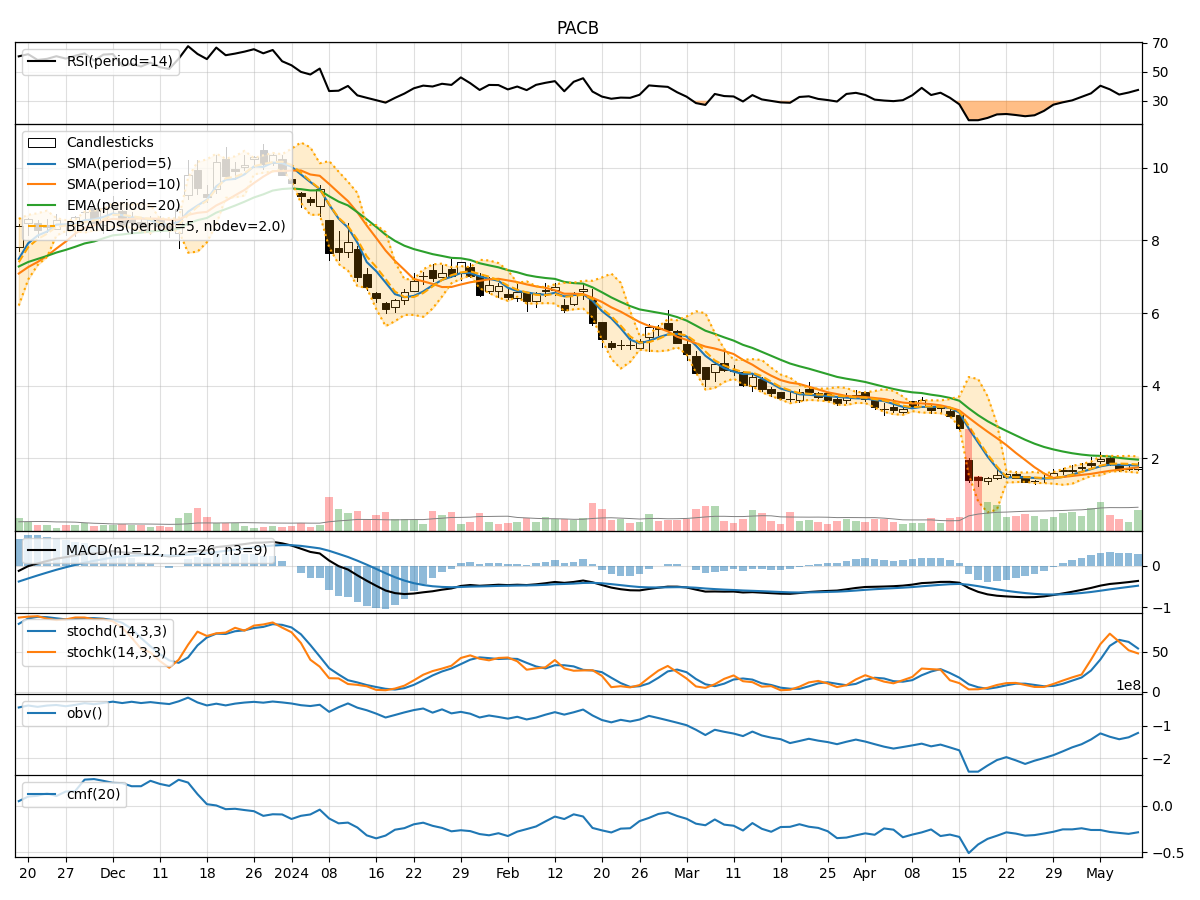
- Moving Averages (MA): The 5-day MA has been fluctuating around the closing prices, indicating short-term price trends. The SMA(10) and EMA(20) show a downward trend, suggesting a bearish sentiment in the medium to long term.
- MACD: The MACD line has been consistently below the signal line, indicating a bearish trend in the stock price.
- Conclusion: The trend indicators suggest a bearish outlook for PACB in the near future.
Momentum Analysis:
- RSI: The RSI values have been fluctuating around the 40-50 range, indicating a lack of strong momentum in either direction.
- Stochastic Oscillator: Both %K and %D values are relatively low, suggesting a lack of strong buying or selling pressure.
- Conclusion: The momentum indicators reflect a neutral stance with no clear direction for PACB.
Volatility Analysis:
- Bollinger Bands: The stock price has been trading within the bands, with the %B indicator showing fluctuations but not indicating extreme overbought or oversold conditions.
- Conclusion: Volatility indicators suggest a sideways movement with no significant volatility expected in the near term.
Volume Analysis:
- On-Balance Volume (OBV): The OBV values have been mixed, indicating some distribution of shares on certain days.
- Chaikin Money Flow (CMF): The CMF values are negative, suggesting a net outflow of money from the stock.
- Conclusion: Volume indicators point towards a bearish sentiment with more selling pressure than buying interest.
Overall Conclusion:
Based on the analysis of trend, momentum, volatility, and volume indicators, the overall outlook for PACB in the next few days is bearish. The trend indicators and volume analysis suggest a downward trajectory, while the momentum and volatility indicators indicate a lack of strong positive momentum or significant price movements. Therefore, investors should exercise caution and consider potential downside risks when making decisions related to PACB in the near future.
Key Takeaways:
- Direction: Downward
- Momentum: Neutral
- Volatility: Sideways
- Volume: Bearish
Disclaimer:
This analysis is based solely on technical indicators and historical data, and it is important to consider other fundamental factors and market dynamics before making investment decisions. It is recommended to conduct thorough research and consult with a financial advisor for personalized guidance tailored to individual investment goals and risk tolerance levels.