Technical Analysis of PARAA 2024-05-10
Overview:
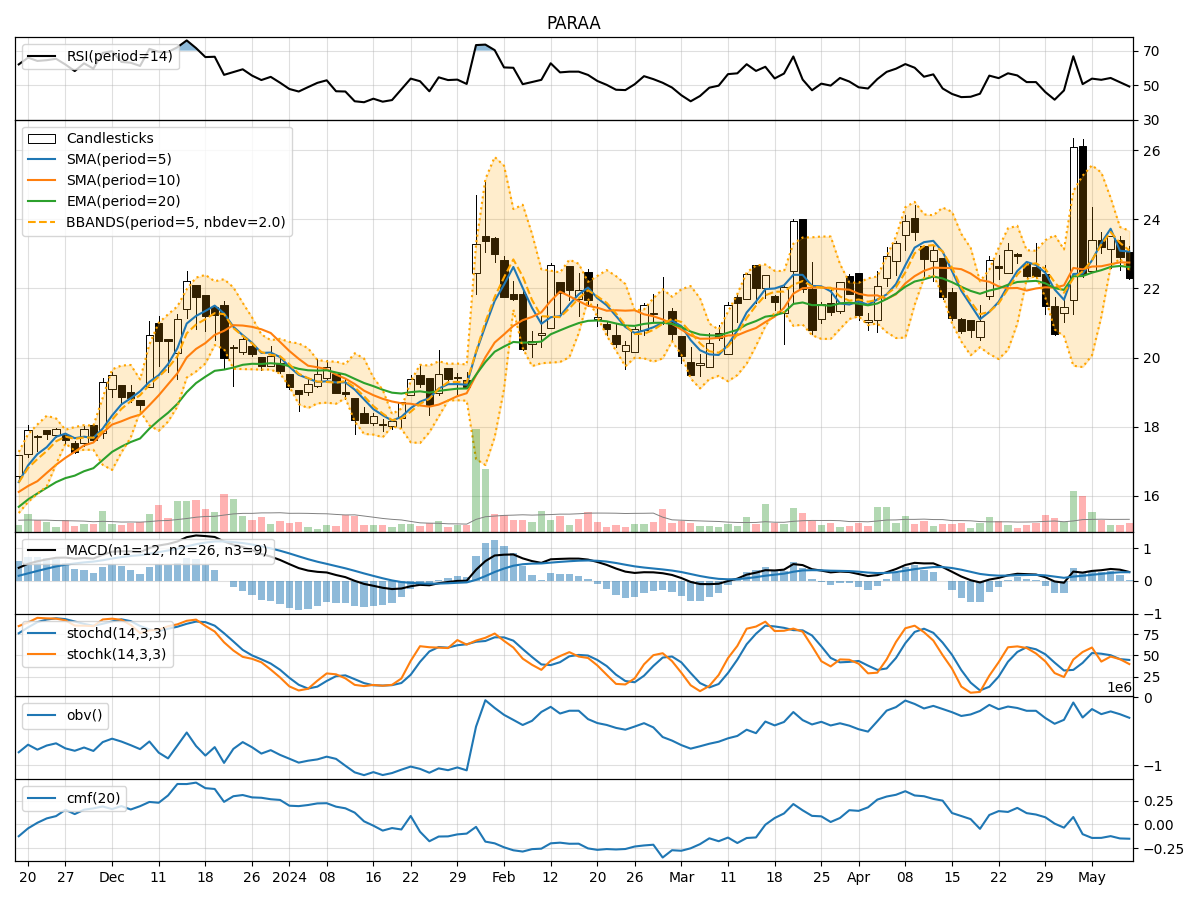
In analyzing the technical indicators for PARAA stock over the last 5 days, we will delve into the trends, momentum, volatility, and volume aspects to provide a comprehensive outlook on the possible stock price movement in the coming days. By examining key indicators such as moving averages, MACD, RSI, Bollinger Bands, and OBV, we aim to offer valuable insights and predictions for informed decision-making.
Trend Analysis:
- Moving Averages (MA): The 5-day MA has been consistently above the closing prices, indicating a short-term uptrend.
- MACD: The MACD line has been positive, with the MACD histogram showing an increasing trend, suggesting bullish momentum.
Momentum Analysis:
- RSI: The RSI values have been fluctuating around the mid-level, indicating a lack of strong momentum in either direction.
- Stochastic Oscillator: Both %K and %D values have been relatively low, reflecting a potential oversold condition.
Volatility Analysis:
- Bollinger Bands (BB): The stock price has been trading within the bands, with the %B indicator hovering around the middle, suggesting moderate volatility.
Volume Analysis:
- On-Balance Volume (OBV): The OBV values have been fluctuating, indicating a balance between buying and selling pressure.
Key Observations:
- The stock is currently in a short-term uptrend based on moving averages and MACD.
- Momentum indicators like RSI and Stochastic Oscillator suggest a lack of strong directional momentum.
- Volatility remains moderate as per Bollinger Bands analysis.
- Volume indicators show a balanced buying and selling pressure.
Conclusion:
Based on the analysis of technical indicators, the next few days for PARAA stock are likely to see sideways movement with limited volatility. The lack of strong momentum signals and the balanced volume suggest a period of consolidation. Traders may expect the stock price to trade within a narrow range without a clear trend in the near term. It is advisable to closely monitor key support and resistance levels for potential breakout opportunities.