Technical Analysis of PAX 2024-05-10
Overview:
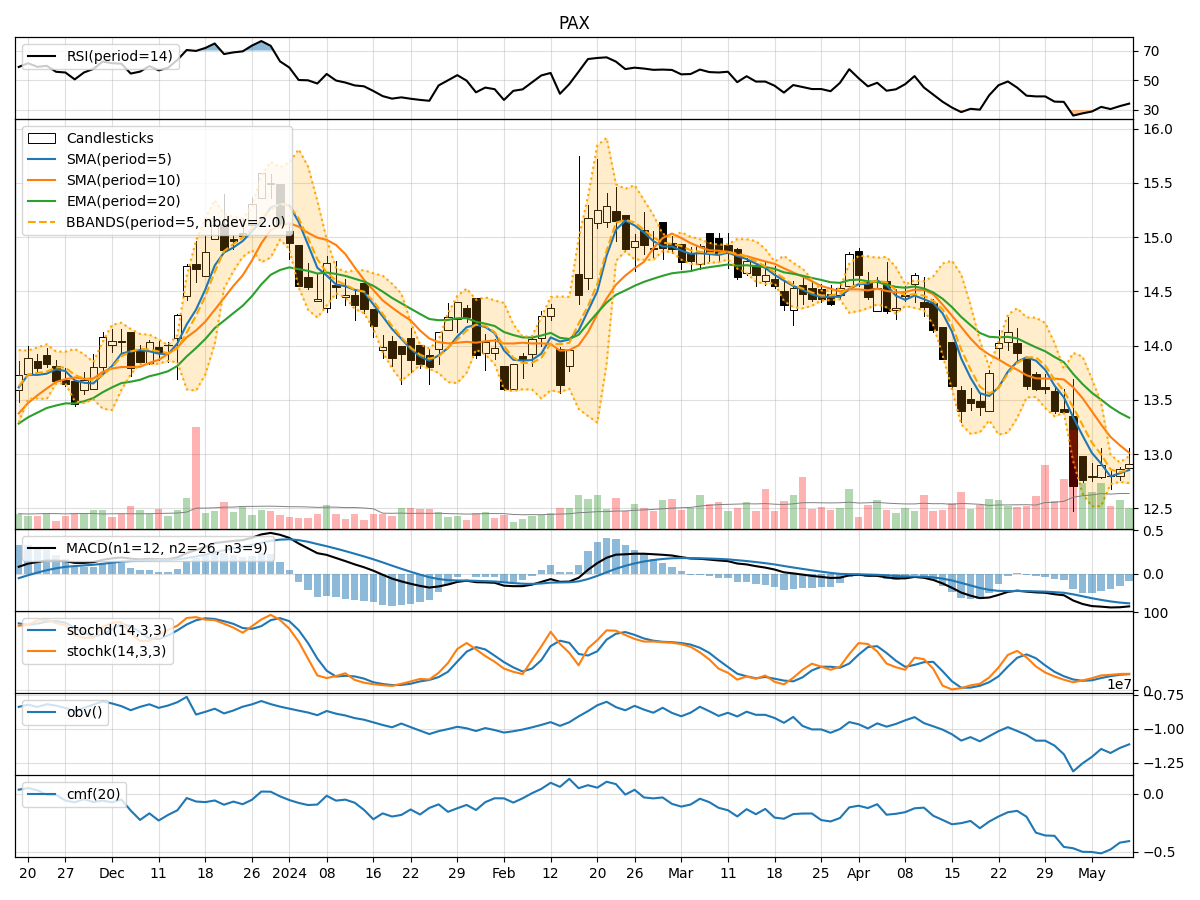
In analyzing the technical indicators for PAX stock over the last 5 days, we will delve into the trend, momentum, volatility, and volume indicators to provide a comprehensive outlook on the possible future stock price movement. By examining these key indicators, we aim to offer valuable insights and predictions for the upcoming trading days.
Trend Analysis:
- Moving Averages (MA): The 5-day Moving Average (MA) has been consistently below the Simple Moving Average (SMA) and Exponential Moving Average (EMA), indicating a downward trend in the stock price.
- MACD: The MACD line has been below the signal line, with the MACD histogram showing negative values, suggesting bearish momentum in the stock.
Momentum Analysis:
- RSI: The Relative Strength Index (RSI) has been below 50, indicating a bearish momentum in the stock.
- Stochastic Oscillator: Both %K and %D lines of the Stochastic Oscillator have been below 20, signaling an oversold condition in the stock.
Volatility Analysis:
- Bollinger Bands (BB): The stock price has been trading below the middle Bollinger Band (BBM), indicating a lower volatility period.
- Bollinger Band %B: The %B value has been below 1, suggesting that the stock price is trading below the lower Bollinger Band, indicating a potential oversold condition.
Volume Analysis:
- On-Balance Volume (OBV): The OBV has been decreasing over the last 5 days, indicating a higher selling pressure in the stock.
- Chaikin Money Flow (CMF): The CMF has been negative, suggesting that money is flowing out of the stock.
Conclusion:
Based on the analysis of the technical indicators, the stock of PAX is currently in a bearish trend with downward momentum and lower volatility. The selling pressure indicated by the volume indicators further supports the bearish outlook.
Future Price Movement Prediction:
Considering the current bearish trend and momentum, as well as the oversold conditions highlighted by the stochastic oscillator and Bollinger Bands, it is likely that the stock price of PAX will continue to face downward pressure in the next few trading days. Traders and investors should exercise caution and consider short-term selling or staying on the sidelines until a clear reversal pattern emerges.
Key Recommendations:
- Short-Term Traders: Consider short-selling or waiting for a potential bounce-back opportunity.
- Long-Term Investors: Monitor the stock closely for a potential trend reversal before considering any buying opportunities.
- Risk Management: Implement strict stop-loss strategies to mitigate potential losses in a volatile market environment.
In conclusion, the technical analysis suggests a bearish outlook for PAX stock in the near term, emphasizing the importance of prudent risk management and strategic decision-making in navigating the current market conditions.