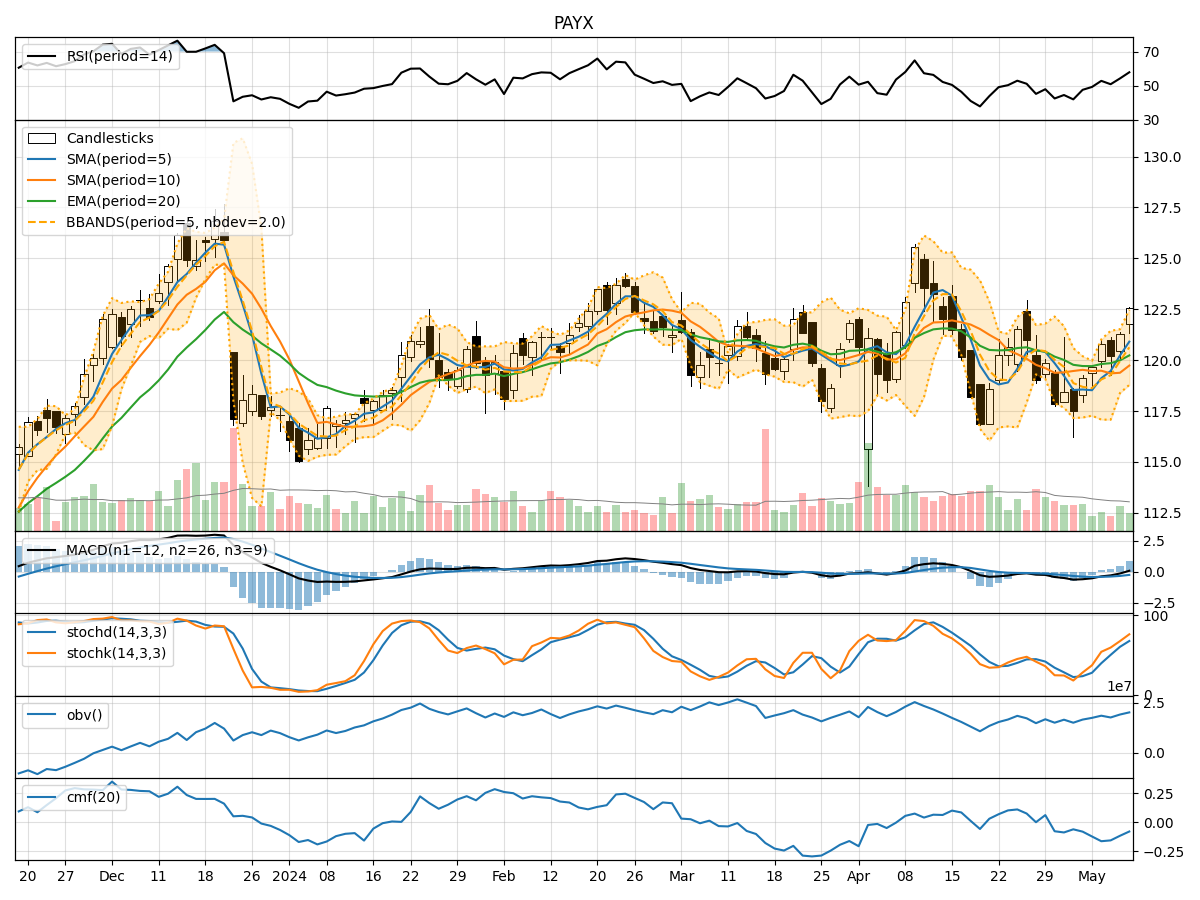
Technical Analysis of PAYX 2024-05-10
Overview:
In analyzing the technical indicators for PAYX over the last 5 days, we will delve into the trend, momentum, volatility, and volume indicators to provide a comprehensive outlook on the possible stock price movement in the coming days.
Trend Analysis:
- Moving Averages (MA): The 5-day Moving Average has been trending upwards, indicating a positive short-term momentum.
- MACD: The MACD line has been consistently above the signal line, suggesting a bullish trend.
- RSI: The RSI is in the neutral zone, indicating a balanced market sentiment.
Momentum Analysis:
- Stochastic Oscillator: Both %K and %D are in the overbought territory, signaling a potential reversal or consolidation.
- Williams %R: The indicator is in the oversold region, hinting at a possible buying opportunity.
Volatility Analysis:
- Bollinger Bands: The stock price has been trading near the upper Bollinger Band, indicating high volatility and a potential overbought condition.
- Average True Range (ATR): The ATR value has been relatively high, suggesting increased price volatility.
Volume Analysis:
- On-Balance Volume (OBV): The OBV has shown mixed signals, reflecting indecision among market participants.
- Chaikin Money Flow (CMF): The CMF is negative, indicating selling pressure in the market.
Key Observations:
- The stock is currently in a bullish trend based on moving averages and MACD.
- Momentum indicators suggest a potential reversal due to overbought conditions.
- Volatility is high, indicating increased price fluctuations.
- Volume indicators show mixed signals with a slight bias towards selling pressure.
Conclusion:
Based on the technical analysis of trend, momentum, volatility, and volume indicators, the next few days for PAYX could see a short-term pullback or consolidation as momentum indicators signal overbought conditions. However, the overall trend remains bullish, so any pullback may present a buying opportunity for traders looking to capitalize on the stock's upward momentum. It is essential to monitor key support and resistance levels closely to gauge the stock's price action accurately.