Technical Analysis of PEGA 2024-05-10
Overview:
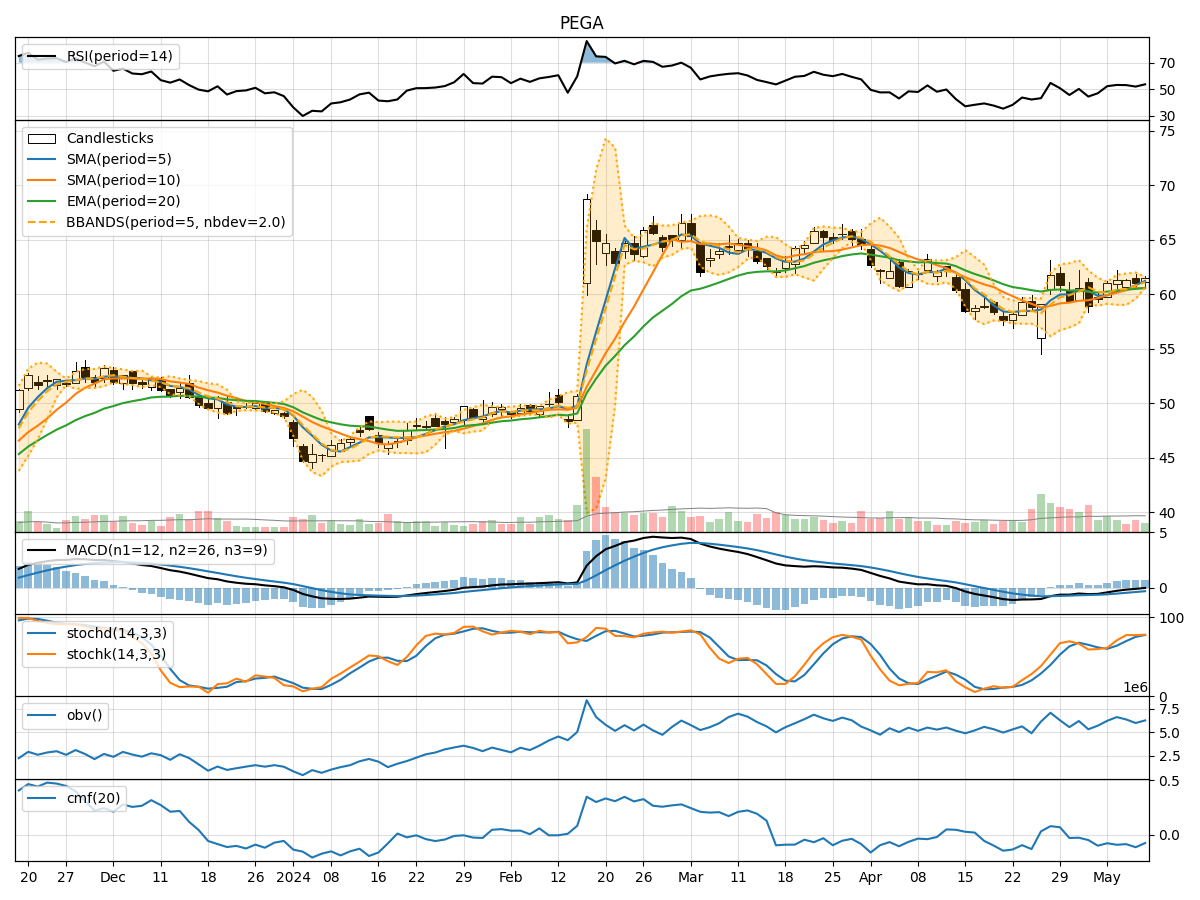
In analyzing the technical indicators for PEGA over the last 5 days, we will delve into the trend, momentum, volatility, and volume indicators to provide a comprehensive outlook on the possible stock price movement in the coming days. By examining these key indicators, we aim to offer valuable insights and predictions for potential investors and traders.
Trend Indicators:
- Moving Averages (MA): The 5-day Moving Average has been consistently above the Simple Moving Average (SMA) and Exponential Moving Average (EMA), indicating a bullish trend.
- MACD: The MACD line has been negative but converging towards the signal line, suggesting a potential bullish crossover.
- MACD Histogram: The histogram has been increasing, indicating strengthening bullish momentum.
Momentum Indicators:
- RSI: The Relative Strength Index (RSI) has been fluctuating around the neutral level, indicating indecision in the market.
- Stochastic Oscillator: Both %K and %D have been in overbought territory, signaling a potential reversal.
- Williams %R: The indicator has been hovering in the oversold region, suggesting a possible bullish reversal.
Volatility Indicators:
- Bollinger Bands: The stock price has been trading within the bands, with the bands narrowing, indicating reduced volatility.
- Bollinger %B: The %B indicator has been fluctuating around 0.5, suggesting a balanced market sentiment.
Volume Indicators:
- On-Balance Volume (OBV): The OBV has been declining, indicating selling pressure in the market.
- Chaikin Money Flow (CMF): The CMF has been negative, reflecting a lack of buying interest.
Key Observations and Opinions:
- Trend: The trend indicators suggest a potential bullish bias in the short term.
- Momentum: Mixed signals from momentum indicators indicate a possible consolidation phase.
- Volatility: Decreasing volatility may lead to a period of sideways movement.
- Volume: Declining OBV and negative CMF point towards a bearish sentiment in the market.
Conclusion:
Based on the analysis of the technical indicators, the next few days for PEGA stock price movement could be sideways with a slight bearish bias. Traders should exercise caution and wait for clearer signals before making significant trading decisions. It is advisable to monitor key support and resistance levels closely to gauge the direction of the stock price movement accurately.