Technical Analysis of PENN 2024-05-10
Overview:
In analyzing the technical indicators for PENN over the last 5 days, we will delve into the trend, momentum, volatility, and volume indicators to provide a comprehensive outlook on the possible stock price movement in the coming days. By examining these key aspects, we aim to offer valuable insights and recommendations for potential investors.
Trend Indicators:
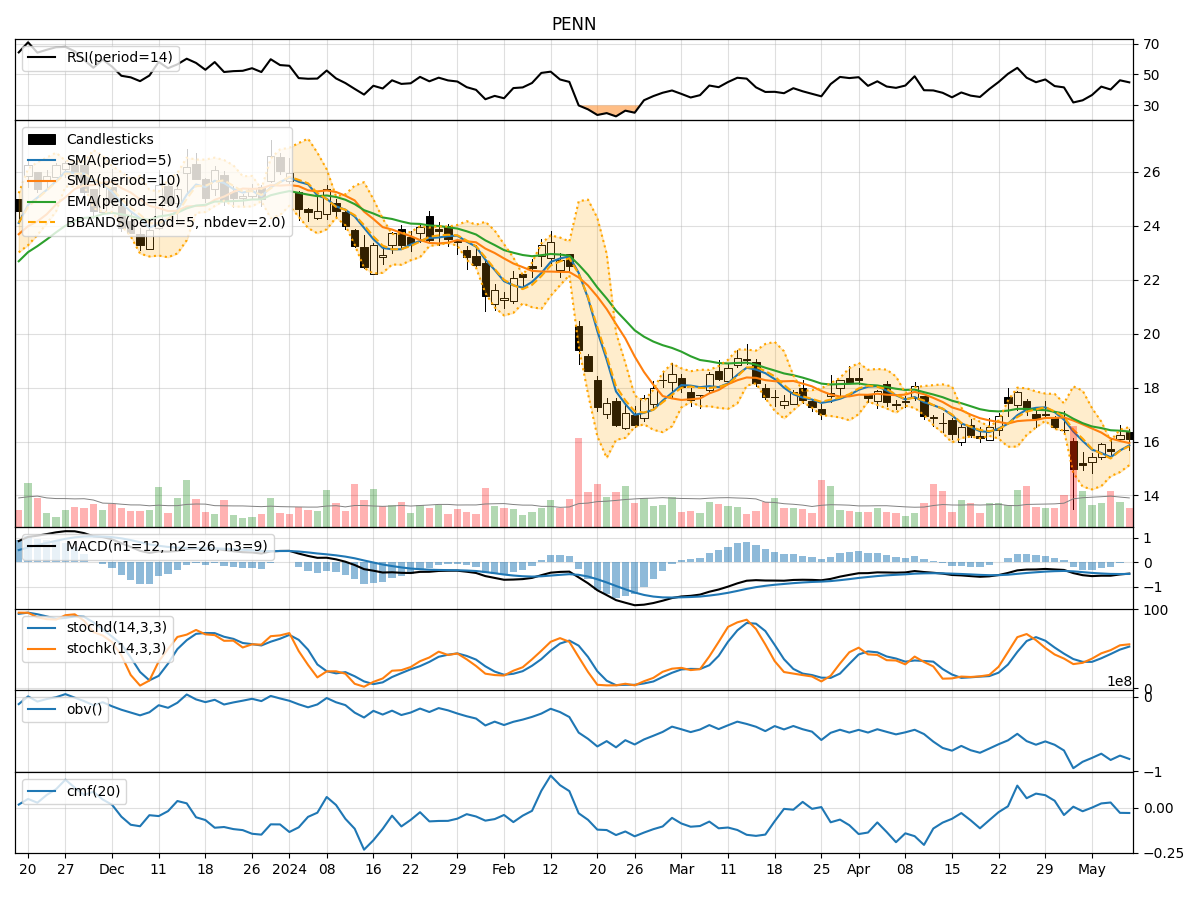
- Moving Averages (MA): The 5-day moving average has been consistently below the simple moving average (SMA) and exponential moving average (EMA) over the past 5 days, indicating a downward trend.
- MACD: The MACD line has been negative, with the MACD histogram also showing a downward trend, suggesting bearish momentum in the stock price.
Momentum Indicators:
- RSI: The Relative Strength Index (RSI) has been below 50, indicating bearish momentum in the stock.
- Stochastic Oscillator: Both %K and %D lines of the Stochastic Oscillator have been trending downwards, further supporting the bearish sentiment.
- Williams %R: The Williams %R indicator has been in the oversold territory, suggesting a potential reversal or continuation of the downtrend.
Volatility Indicators:
- Bollinger Bands: The stock price has been consistently trading below the middle Bollinger Band (BBM), indicating a bearish trend.
- Bollinger %B: The %B indicator has been below 1, suggesting that the stock price is trading below the lower Bollinger Band, signaling a potential oversold condition.
Volume Indicators:
- On-Balance Volume (OBV): The OBV has been negative over the past 5 days, indicating selling pressure in the stock.
- Chaikin Money Flow (CMF): The CMF has been negative, reflecting a lack of buying interest in the stock.
Key Observations and Opinions:
- Trend: The trend indicators, including moving averages and MACD, all point towards a bearish sentiment in the stock price.
- Momentum: Momentum indicators like RSI, Stochastic Oscillator, and Williams %R all suggest a bearish momentum in the stock.
- Volatility: Volatility indicators, particularly Bollinger Bands and %B, indicate a bearish trend with the stock trading below the lower Bollinger Band.
- Volume: Volume indicators such as OBV and CMF highlight a bearish sentiment with selling pressure and lack of buying interest.
Conclusion:
Based on the analysis of the technical indicators across trend, momentum, volatility, and volume, the overall outlook for PENN in the next few days is bearish. The stock is likely to experience further downward movement, potentially indicating a continuation of the current downtrend. Investors should exercise caution and consider waiting for more favorable technical signals before considering any long positions.