Technical Analysis of PINC 2024-05-10
Overview:
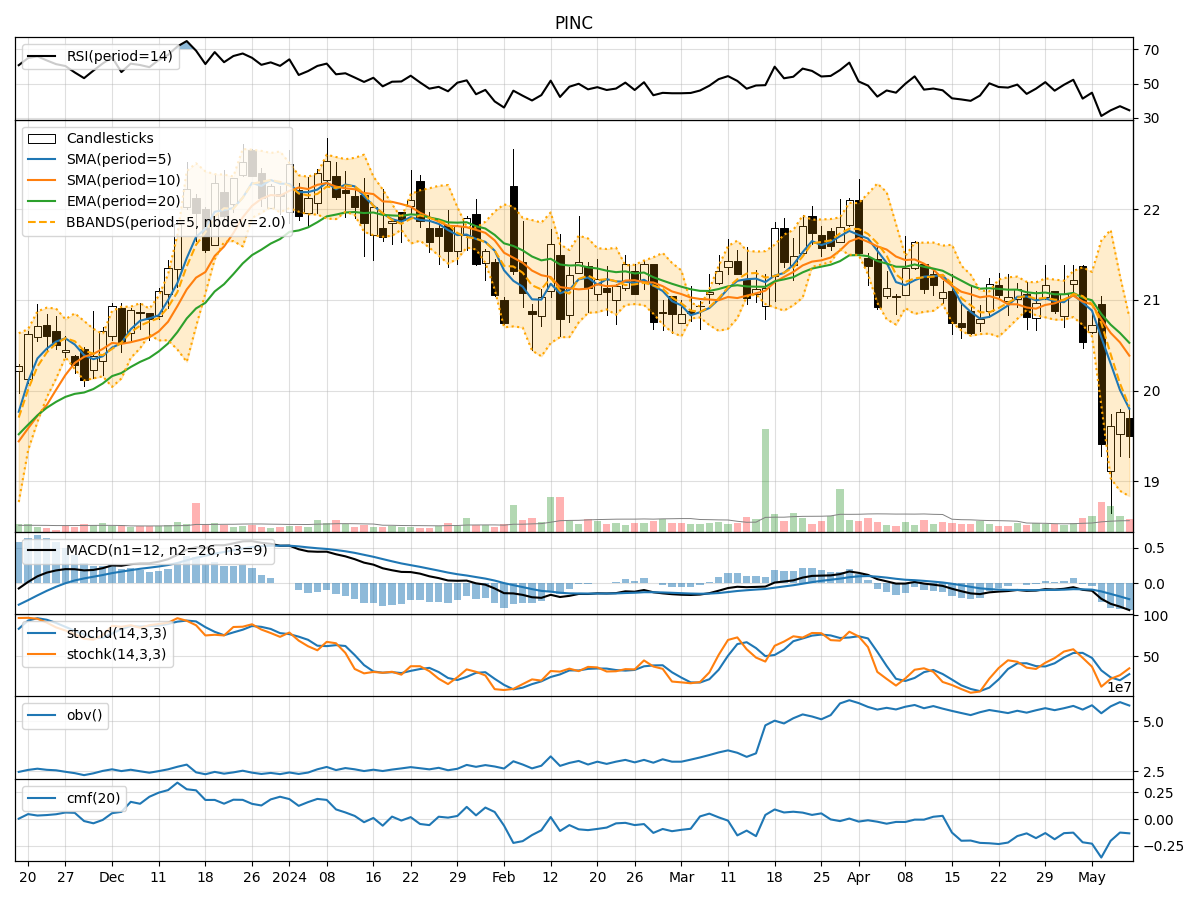
In analyzing the technical indicators for PINC over the last 5 days, we will delve into the trend, momentum, volatility, and volume indicators to provide a comprehensive outlook on the possible stock price movement. By examining these key factors, we aim to offer valuable insights and predictions for the upcoming days.
Trend Analysis:
- Moving Averages (MA): The 5-day MA has been consistently below the closing price, indicating a short-term downtrend.
- MACD: The MACD line has been decreasing, with the MACD histogram also showing a downward trend, suggesting bearish momentum.
Momentum Analysis:
- RSI: The RSI has been hovering around the oversold territory, indicating a potential reversal or consolidation phase.
- Stochastic Oscillator: Both %K and %D have been relatively low, signaling a potential oversold condition.
Volatility Analysis:
- Bollinger Bands (BB): The stock price has been trading below the lower Bollinger Band, indicating oversold conditions.
Volume Analysis:
- On-Balance Volume (OBV): The OBV has been fluctuating, suggesting indecision among market participants.
- Chaikin Money Flow (CMF): The CMF has been negative, indicating selling pressure in the stock.
Key Observations:
- The stock is currently in a downtrend based on moving averages and MACD.
- Momentum indicators suggest a potential reversal or consolidation phase.
- Volatility indicators point towards oversold conditions.
- Volume indicators reflect indecisiveness and selling pressure in the market.
Conclusion:
Based on the analysis of technical indicators, the next few days for PINC are likely to see further downside movement in the stock price. The current trend, momentum, and volume signals all point towards a continuation of the bearish sentiment. Traders and investors should exercise caution and consider waiting for more definitive signs of a reversal before considering long positions.