Technical Analysis of POCI 2024-05-31
Overview:
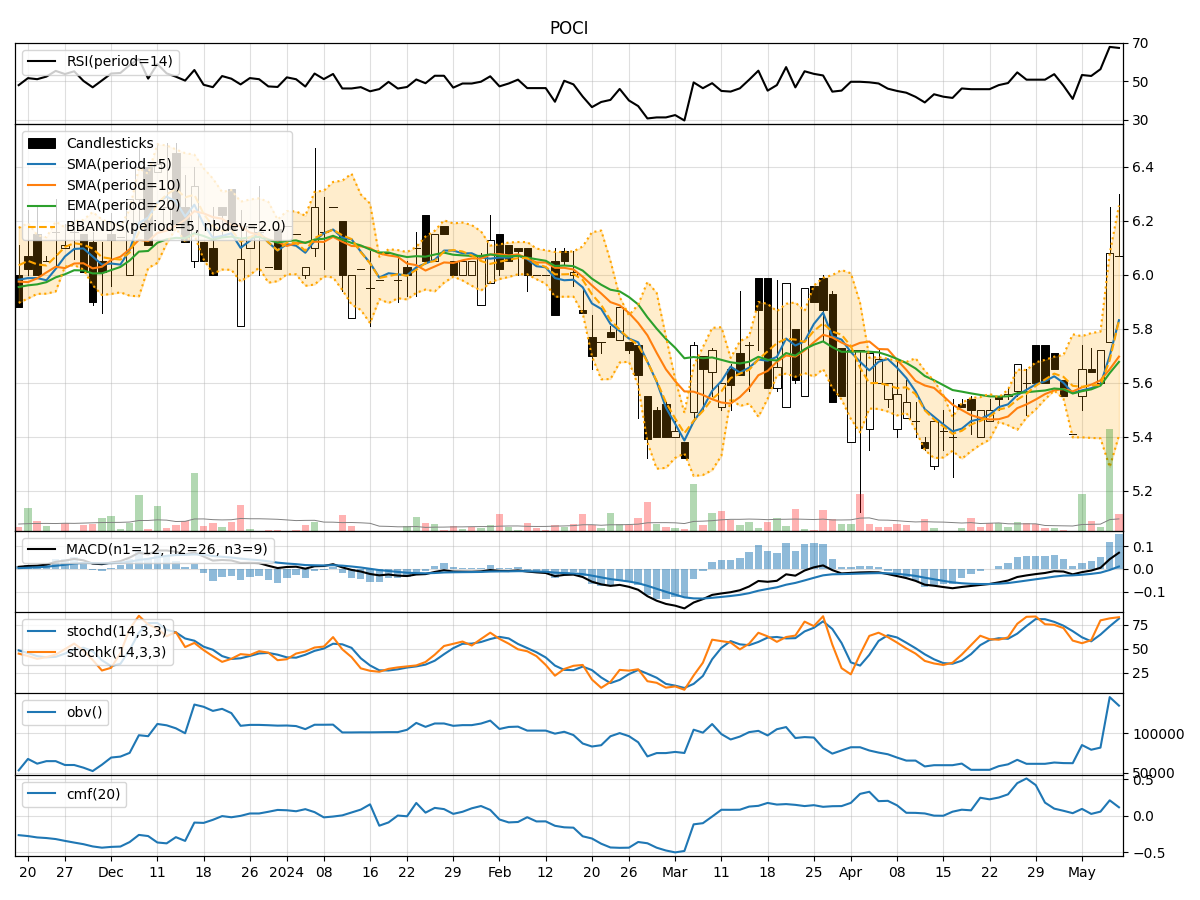
In analyzing the provided POCI TA data for the last 5 days, we will delve into the technical indicators across trend, momentum, volatility, and volume to derive insights into the possible future stock price movement. By examining key metrics such as moving averages, MACD, RSI, Bollinger Bands, and OBV, we aim to provide a comprehensive and insightful analysis to guide potential trading decisions.
Trend Analysis:
- Moving Averages (MA): The 5-day MA has been fluctuating around the closing prices, indicating short-term price trends. The stock has been trading close to the MA, suggesting a balanced market sentiment.
- MACD: The MACD line has shown slight fluctuations, with the MACD histogram hovering around the zero line. This indicates a lack of strong momentum in either direction.
Momentum Analysis:
- RSI: The RSI values have fluctuated within the neutral zone, indicating a lack of strong overbought or oversold conditions.
- Stochastic Oscillator: The stochastic indicators have shown mixed signals, with the %K and %D lines not exhibiting clear trends.
Volatility Analysis:
- Bollinger Bands (BB): The Bollinger Bands have shown narrowing volatility, with the stock price moving within the bands. This suggests a period of consolidation and potential for a breakout.
Volume Analysis:
- On-Balance Volume (OBV): The OBV values have been relatively stable, indicating a balance between buying and selling pressure.
Key Observations:
- The stock has been trading within a tight range, reflecting a period of consolidation.
- The lack of strong trends in the trend and momentum indicators suggests indecision in the market.
- Volatility has been decreasing, indicating a potential buildup of pressure for a significant price movement.
- Volume has remained steady, signaling a balanced participation from buyers and sellers.
Conclusion:
Based on the analysis of the technical indicators, the stock is likely to experience sideways movement in the near term. The lack of clear trends in the trend and momentum indicators, coupled with decreasing volatility, points towards a period of consolidation. Traders should exercise caution and wait for a breakout or a clearer trend to emerge before making significant trading decisions.