Technical Analysis of POOL 2024-05-10
Overview:
In analyzing the technical indicators for POOL stock over the last 5 days, we will delve into the trend, momentum, volatility, and volume indicators to provide a comprehensive outlook on the possible future stock price movement. By examining these key indicators, we aim to offer valuable insights and recommendations for potential investors.
Trend Indicators:
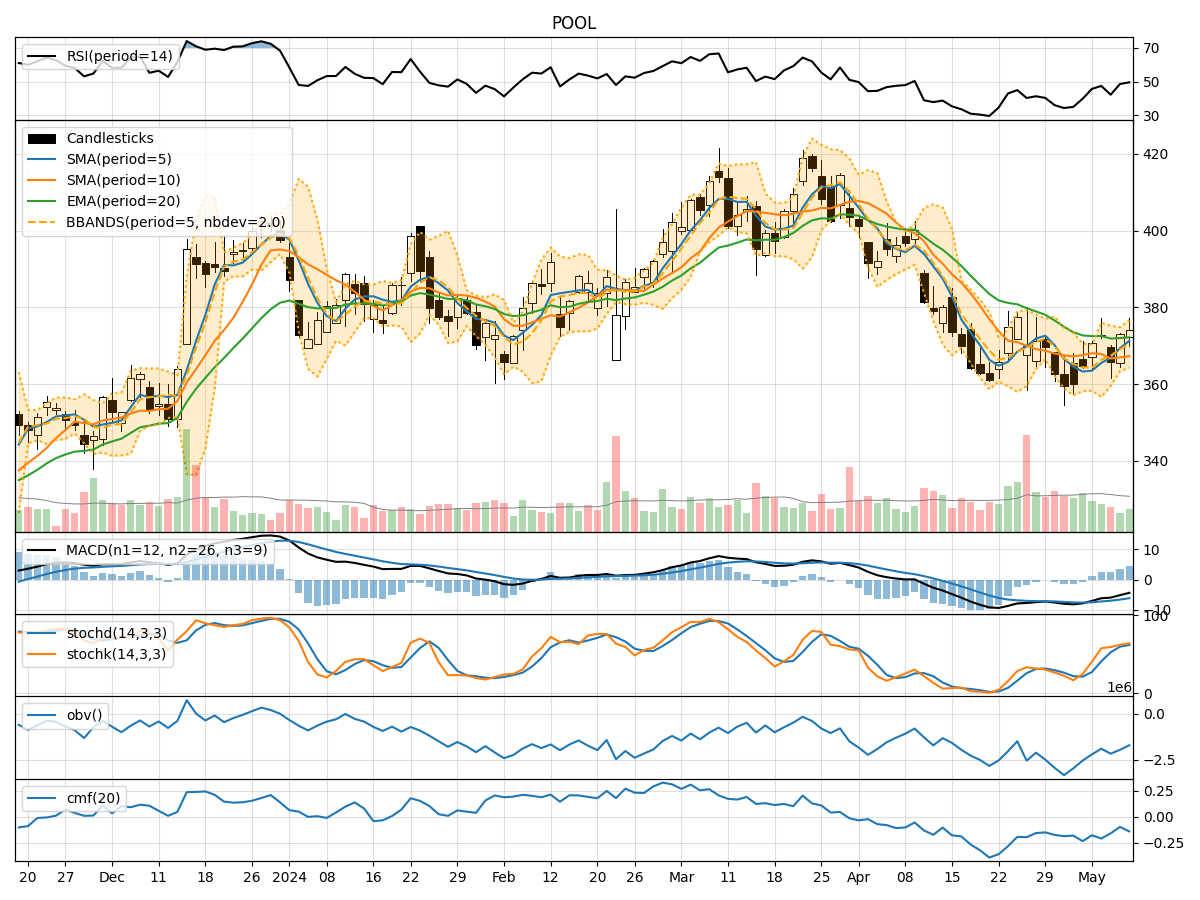
- Moving Averages (MA): The 5-day moving average has been consistently above the simple moving average (SMA) and exponential moving average (EMA), indicating a short-term bullish trend.
- MACD: The MACD line has been gradually improving, moving closer to the signal line, suggesting a potential bullish crossover.
- MACD Histogram: The histogram has been increasing, indicating strengthening bullish momentum.
Momentum Indicators:
- RSI: The Relative Strength Index (RSI) has been fluctuating around the neutral zone, indicating indecision in the market.
- Stochastic Oscillator: Both %K and %D lines have been rising, signaling increasing buying pressure.
- Williams %R: The Williams %R is hovering in the oversold territory, suggesting a potential reversal in the near term.
Volatility Indicators:
- Bollinger Bands: The stock price has been trading within the bands, with the bands narrowing, indicating decreasing volatility.
- Bollinger %B: The %B indicator is below 1, suggesting the stock is trading below the lower band, potentially indicating an oversold condition.
Volume Indicators:
- On-Balance Volume (OBV): The OBV has shown mixed signals, with some days experiencing selling pressure and others showing accumulation.
- Chaikin Money Flow (CMF): The CMF has been negative, indicating outflows from the stock.
Key Observations and Opinions:
- Trend: The trend indicators suggest a short-term bullish bias.
- Momentum: Momentum indicators show mixed signals, with RSI indicating neutrality and stochastic oscillators hinting at potential buying opportunities.
- Volatility: Volatility has been decreasing, potentially signaling a period of consolidation.
- Volume: Volume indicators are inconclusive, with OBV showing mixed signals and CMF indicating negative money flow.
Conclusion:
Based on the analysis of the technical indicators, the next few days for POOL stock could see sideways movement with a slight bullish bias. Investors should closely monitor the MACD for a potential bullish crossover confirmation and watch for any reversal signals from the Williams %R indicator. Additionally, keeping an eye on volume trends and any significant news developments could provide further insights into the stock's future price movement.