Technical Analysis of PSHG 2024-05-10
Overview:
In analyzing the technical indicators for PSHG over the last 5 days, we will delve into the trend, momentum, volatility, and volume indicators to provide a comprehensive outlook on the possible stock price movement in the coming days. By examining these key aspects, we aim to offer valuable insights and recommendations for potential investors.
Trend Indicators:
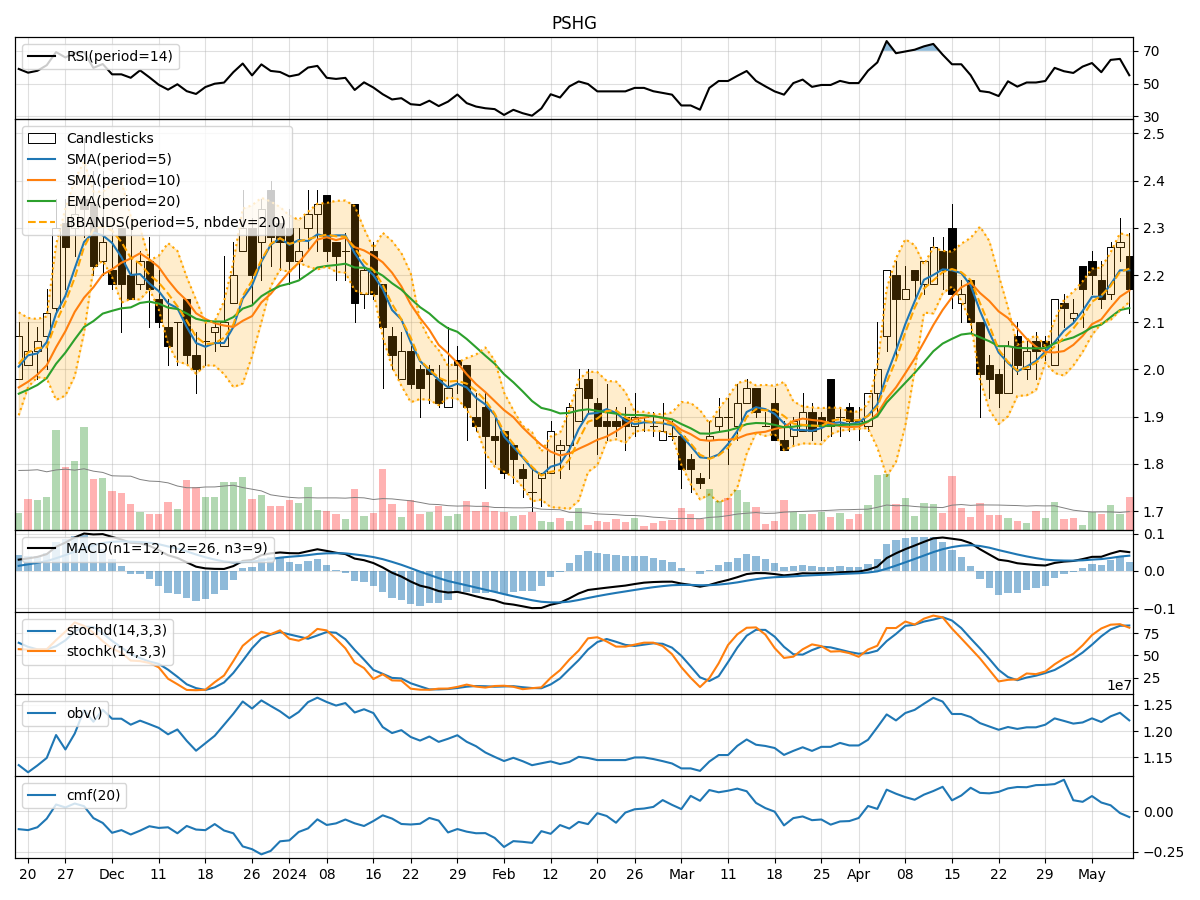
- Moving Averages (MA): The 5-day moving average has been relatively stable, indicating a consistent trend in the stock price.
- MACD: The MACD line has shown a positive trend, with the MACD line consistently above the signal line, suggesting bullish momentum.
- EMA: The exponential moving average has been on an upward trajectory, indicating a positive trend in the stock price.
Momentum Indicators:
- RSI: The Relative Strength Index has been fluctuating but generally staying within the neutral range, suggesting a balanced momentum.
- Stochastic Oscillator: Both %K and %D have been relatively high, indicating potential overbought conditions.
- Williams %R: The Williams %R has been in the oversold territory, signaling a potential reversal in momentum.
Volatility Indicators:
- Bollinger Bands: The Bollinger Bands have shown narrowing volatility, indicating a potential decrease in price fluctuations.
- Bollinger %B: The %B indicator has been fluctuating but is currently below 1, suggesting the stock is trading below the lower band.
Volume Indicators:
- On-Balance Volume (OBV): The OBV has shown mixed signals, with fluctuations in volume accumulation.
- Chaikin Money Flow (CMF): The CMF has been negative, indicating potential selling pressure in the stock.
Key Observations and Opinions:
- Trend: The stock is currently in an upward trend, supported by the positive MACD and EMA indicators.
- Momentum: The momentum indicators suggest a mixed sentiment, with potential overbought conditions and a reversal in momentum indicated by Williams %R.
- Volatility: Volatility is decreasing, as shown by the narrowing Bollinger Bands, which could lead to a period of consolidation.
- Volume: The volume indicators show mixed signals, with OBV fluctuating and CMF indicating selling pressure.
Conclusion:
Based on the analysis of the technical indicators, the next few days for PSHG could see sideways movement or consolidation in the stock price. While the trend is positive, the mixed momentum and volume signals suggest a period of stabilization. Investors should closely monitor key support and resistance levels for potential entry or exit points.