Technical Analysis of PTVE 2024-05-10
Overview:
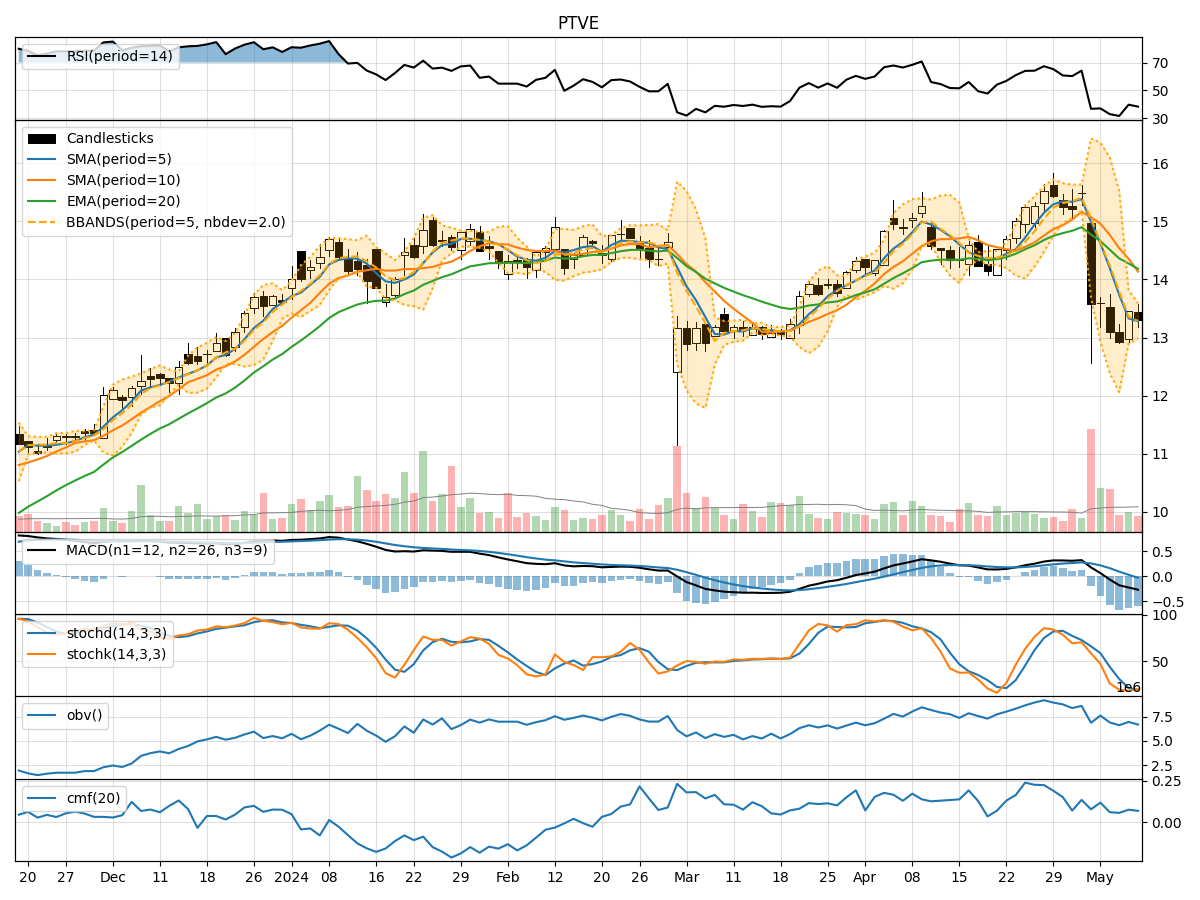
In analyzing the technical indicators for PTVE over the last 5 days, we will delve into the trend, momentum, volatility, and volume indicators to provide a comprehensive outlook on the possible stock price movement in the coming days. By examining these key aspects, we aim to offer valuable insights and predictions for potential investors.
Trend Analysis:
- Moving Averages (MA): The 5-day MA has been consistently below the closing prices, indicating a downward trend.
- MACD: The MACD line has been decreasing, with the MACD histogram also showing negative values, suggesting a bearish trend.
Momentum Analysis:
- RSI: The RSI has been fluctuating in the oversold region, indicating a lack of strong momentum.
- Stochastic Oscillator: Both %K and %D have been low, signaling a potential reversal or consolidation phase.
Volatility Analysis:
- Bollinger Bands (BB): The stock price has been trading below the lower Bollinger Band, indicating oversold conditions.
Volume Analysis:
- On-Balance Volume (OBV): The OBV has been mixed, showing both buying and selling pressure.
- Chaikin Money Flow (CMF): The CMF has been positive but relatively low, suggesting moderate buying pressure.
Key Observations:
- The stock is currently in a downtrend based on moving averages and MACD.
- Momentum indicators show a lack of strong buying or selling pressure.
- Volatility is high, with the stock trading below the lower Bollinger Band.
- Volume indicators indicate mixed sentiment with moderate buying pressure.
Conclusion:
Based on the technical analysis of PTVE, the stock is currently bearish and may continue to face downward pressure in the near term. The lack of strong momentum and the oversold conditions suggest a possible consolidation phase before any potential reversal. Investors should exercise caution and consider waiting for more definitive signals before making any trading decisions.