Technical Analysis of PWM 2024-05-10
Overview:
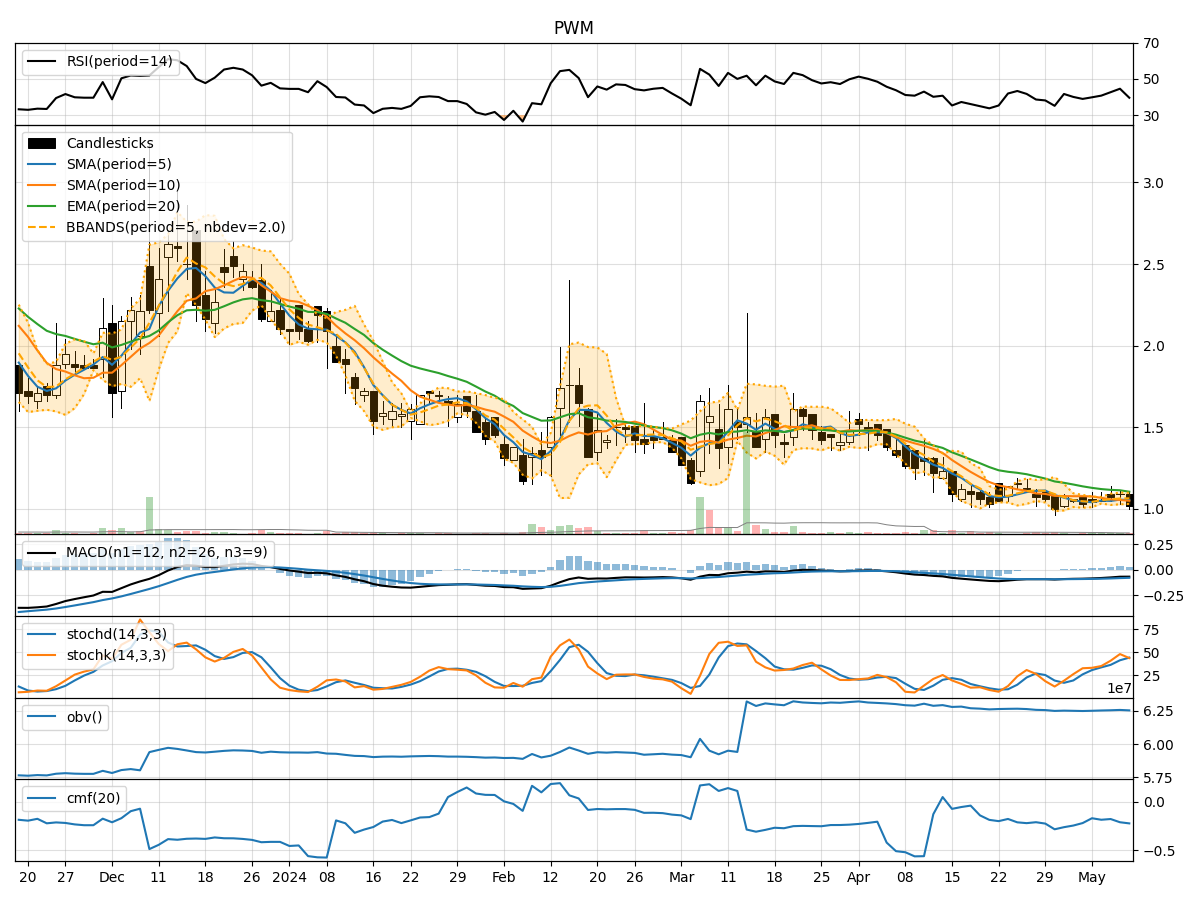
In analyzing the technical indicators for PWM stock over the last 5 days, we will delve into the trend, momentum, volatility, and volume indicators to provide a comprehensive outlook on the possible stock price movement in the coming days. By examining these key indicators, we aim to offer valuable insights and recommendations for potential investors.
Trend Analysis:
- Moving Averages (MA): The 5-day MA has been declining, indicating a short-term bearish trend.
- MACD: The MACD line has been consistently below the signal line, suggesting a bearish momentum.
- EMA: The EMA has been trending downwards, reflecting a bearish sentiment in the stock.
Momentum Analysis:
- RSI: The RSI has been relatively low, indicating oversold conditions in the stock.
- Stochastic Oscillator: Both %K and %D have been fluctuating, but not in overbought or oversold territory.
- Williams %R: The Williams %R is in oversold territory, suggesting a potential reversal.
Volatility Analysis:
- Bollinger Bands (BB): The stock price has been trading within the bands, indicating a period of consolidation.
- Bollinger %B: The %B is near the lower band, suggesting a possible oversold condition.
Volume Analysis:
- On-Balance Volume (OBV): The OBV has been relatively stable, indicating no significant divergence between price and volume.
- Chaikin Money Flow (CMF): The CMF has been negative, reflecting selling pressure in the stock.
Key Observations:
- The stock is currently in a short-term bearish trend based on moving averages and MACD.
- Momentum indicators suggest a potential reversal as the stock is oversold.
- Volatility indicators point towards a period of consolidation.
- Volume indicators show selling pressure but no significant divergence.
Conclusion:
Based on the analysis of technical indicators, the stock price of PWM is likely to experience a short-term consolidation phase with a potential for a bullish reversal. Traders may consider monitoring the stock closely for signs of a trend reversal, especially if momentum indicators start to show bullish signals. It is advisable to wait for confirmation from multiple indicators before making any trading decisions.